Part 2 of a series on rethinking security operations from the ground up.
In Part 1, we argued that the fundamental problem with SIEMs is context blindness. SIEMs ingest logs but don’t understand the identity, devices, resources, and relationships those logs describe. Every downstream capability (detection, investigation, threat hunting) suffers because the foundation is a text index, not a knowledge graph.
This post is about fixing the foundation. If you want context-rich detection, you need context-rich data. And that starts with how you transform raw logs into something a machine or an analyst can reason about.
Why Field Mapping Isn’t Enough
The obvious first step is normalization: mapping vendor-specific fields to a common schema. Okta’s client.ipAddress becomes source_ip. Google Workspace’s ipAddress becomes source_ip. Problem solved.
Except it isn’t. Field mapping gives you a common column name. It doesn’t give you meaning. Knowing that two events share a source_ip column tells you nothing about whether they represent logins, file accesses, API calls, or firewall blocks. The column name doesn’t tell you whether the action is sensitive, whether the principal is a person or a machine, or whether the resource being accessed contains customer PII.
The other temptation is a single schema for all data types. One schema to rule them all. This approach fails for a different reason: the security-relevant structure of a SaaS audit log has almost nothing in common with the structure of an EDR process event or an HTTP access log. Forcing them into the same shape either loses critical fields or drowns every event in columns that are null most of the time.
Giving each event class its own shape, as the open category-based schemas do, helps with the null columns but not with the meaning. A schema defines structure, not judgment: it can say that an event is an identity-management action, but not that suspending a user is CRITICAL on the security sensitivity level while exporting a report is MEDIUM. Encoding that judgment is the part that matters.
We take a different approach: purpose-built semantic models for each type of security data. Each model captures the meaning of its data type: not just the fields, but what they represent for threat detection. Today the models cover SaaS audit logs, HTTP access logs, EDR endpoint telemetry, forward proxy traffic, and network firewall flows, with more being added. Different data types get different models because they represent fundamentally different security surfaces.
SaaS Audit Logs: Who Did What to What, From Where
Every audit log from every supported SaaS application (Okta, Google Workspace, Slack, GitHub, Microsoft 365, Salesforce, 1Password, Atlassian, and more) is normalized into a single semantic model:
Principal performed Action on Resource from Location, with outcome Result
Take this Okta event:
It becomes:
The location line didn’t come from the raw event. That’s geo-IP enrichment, which runs on every event across every model.
This transformation isn’t just field renaming. Three things make it different:
Curated event classification. We maintain 1,000s of event-type mappings across SaaS sources. Each raw vendor event is classified into standardized categories like AUTHENTICATION.LOGIN, ADMINISTRATIVE.ROLE_MANAGEMENT, DATA_LOSS_PREVENTION.FILE_DOWNLOAD, with a sensitivity rating from INFO to CRITICAL. An access.request.condition.delete in Okta is HIGH sensitivity. An analytics.reports.export.generate is MEDIUM. These aren’t auto-generated, but they’re curated classifications that encode security domain knowledge into the data layer.
Portable detection. Once every SaaS event speaks the same language, detection logic becomes vendor-agnostic. A “dormant user performing sensitive actions from a new location” detection works identically across Okta, Microsoft Entra ID, Google Workspace, and Slack. No per-vendor variant is needed. When a vendor changes its schema, we just update the mapping once, while the detections themselves don’t change.
Sub-principal labeling. Every event is tagged with whether the human acted directly or a sub-principal — an OAuth app, API token, or service account — acted on their behalf. A SIEM shows “Jane deleted 500 files” regardless of whether the files were deleted by Jane manually or it was a cleanup app that runs on her behalf once a week. The acting app may be sitting in a raw field somewhere deep inside a log json, but nothing labels it. We distinguish between Jane deleting files in her browser and a third-party backup app doing it through her OAuth grant.
Human-driven and app-driven actions have fundamentally different threat profiles. A human bulk-downloading files might be an insider threat. A backup app doing the same thing on a schedule is routine. Detections can target the right actor: human-only detections filter out automated noise, while dedicated sub-principal detections catch anomalies in OAuth app and token behavior, like a token that suddenly starts accessing resources it never touched before.
HTTP Access Logs: Discovering Your API Surface
Reverse proxy and API gateway logs are a different beast. They’re high-volume and stateless, and the threat surface is usually the API endpoint or the domain, not the identity.
We normalize HTTP logs into a request-centric model:
IP sent Method to Endpoint on Domain, got Status
That event is the starting point. The value is in two things derived from it: which endpoint a request actually hit, and what a normal request to that endpoint looks like.
Automatic Endpoint Discovery
Your applications expose hundreds of API endpoints, but a SIEM sees only raw URLs, each with unique IDs, session tokens, and query strings baked in. Two requests to the same endpoint look like two completely different strings.
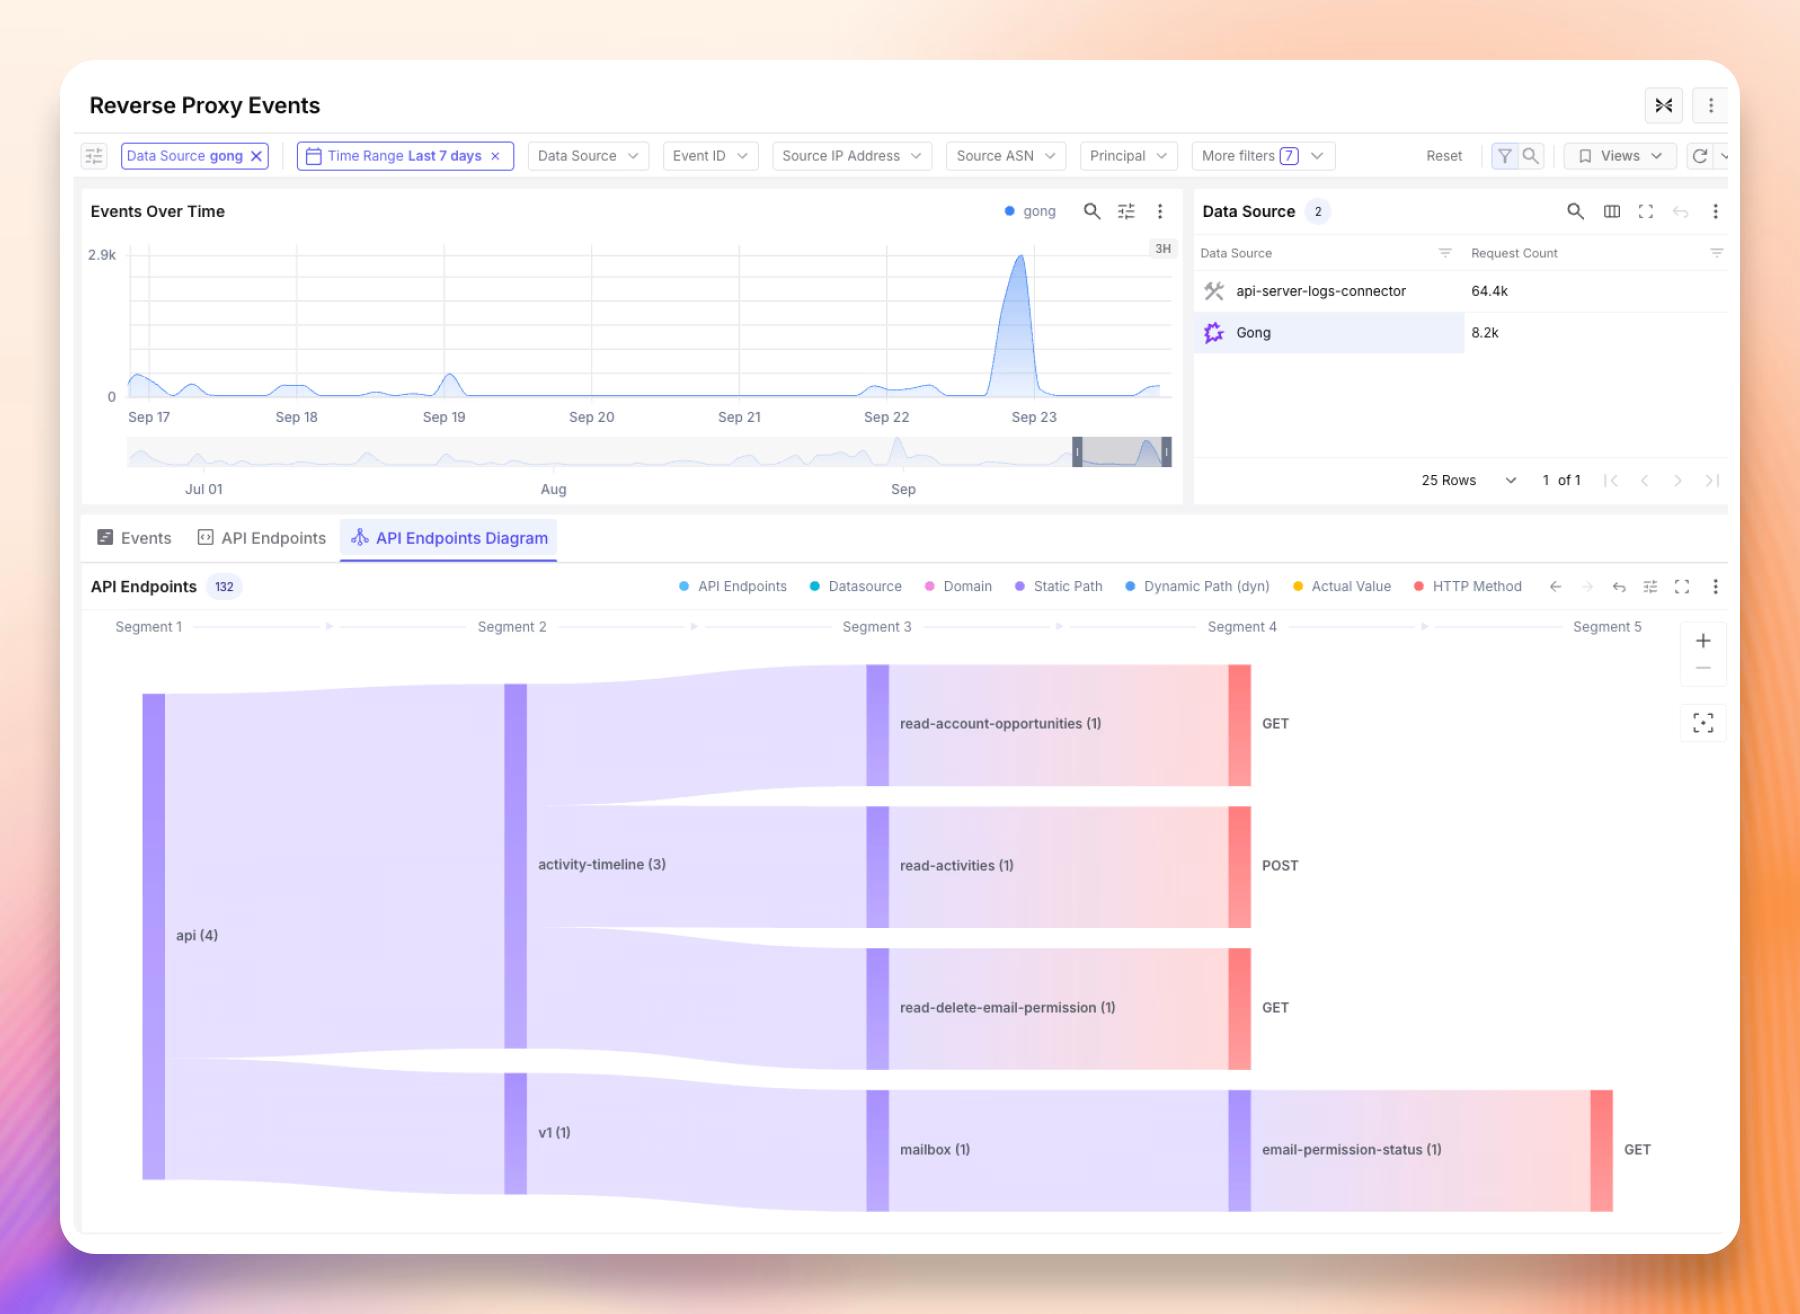
We automatically discover and normalize your API surface from live traffic. URLs like /api/users/550e8400-e29b-41d4/posts and /api/users/a1b2c3d4-ef56-7890/posts are recognized as the same endpoint: /api/users/{id}/posts. No manual configuration, no OpenAPI spec imports, no developer involvement. The system learns your API topology from what’s actually hitting your APIs.
This means the SOC analyst can see which API endpoints exist, how much traffic each handles, and what their normal request patterns look like, even if no one ever documented them.
Discovered API topology for one data source: endpoints fan out by host, path segment, and HTTP method.
Automatic API Contract Learning
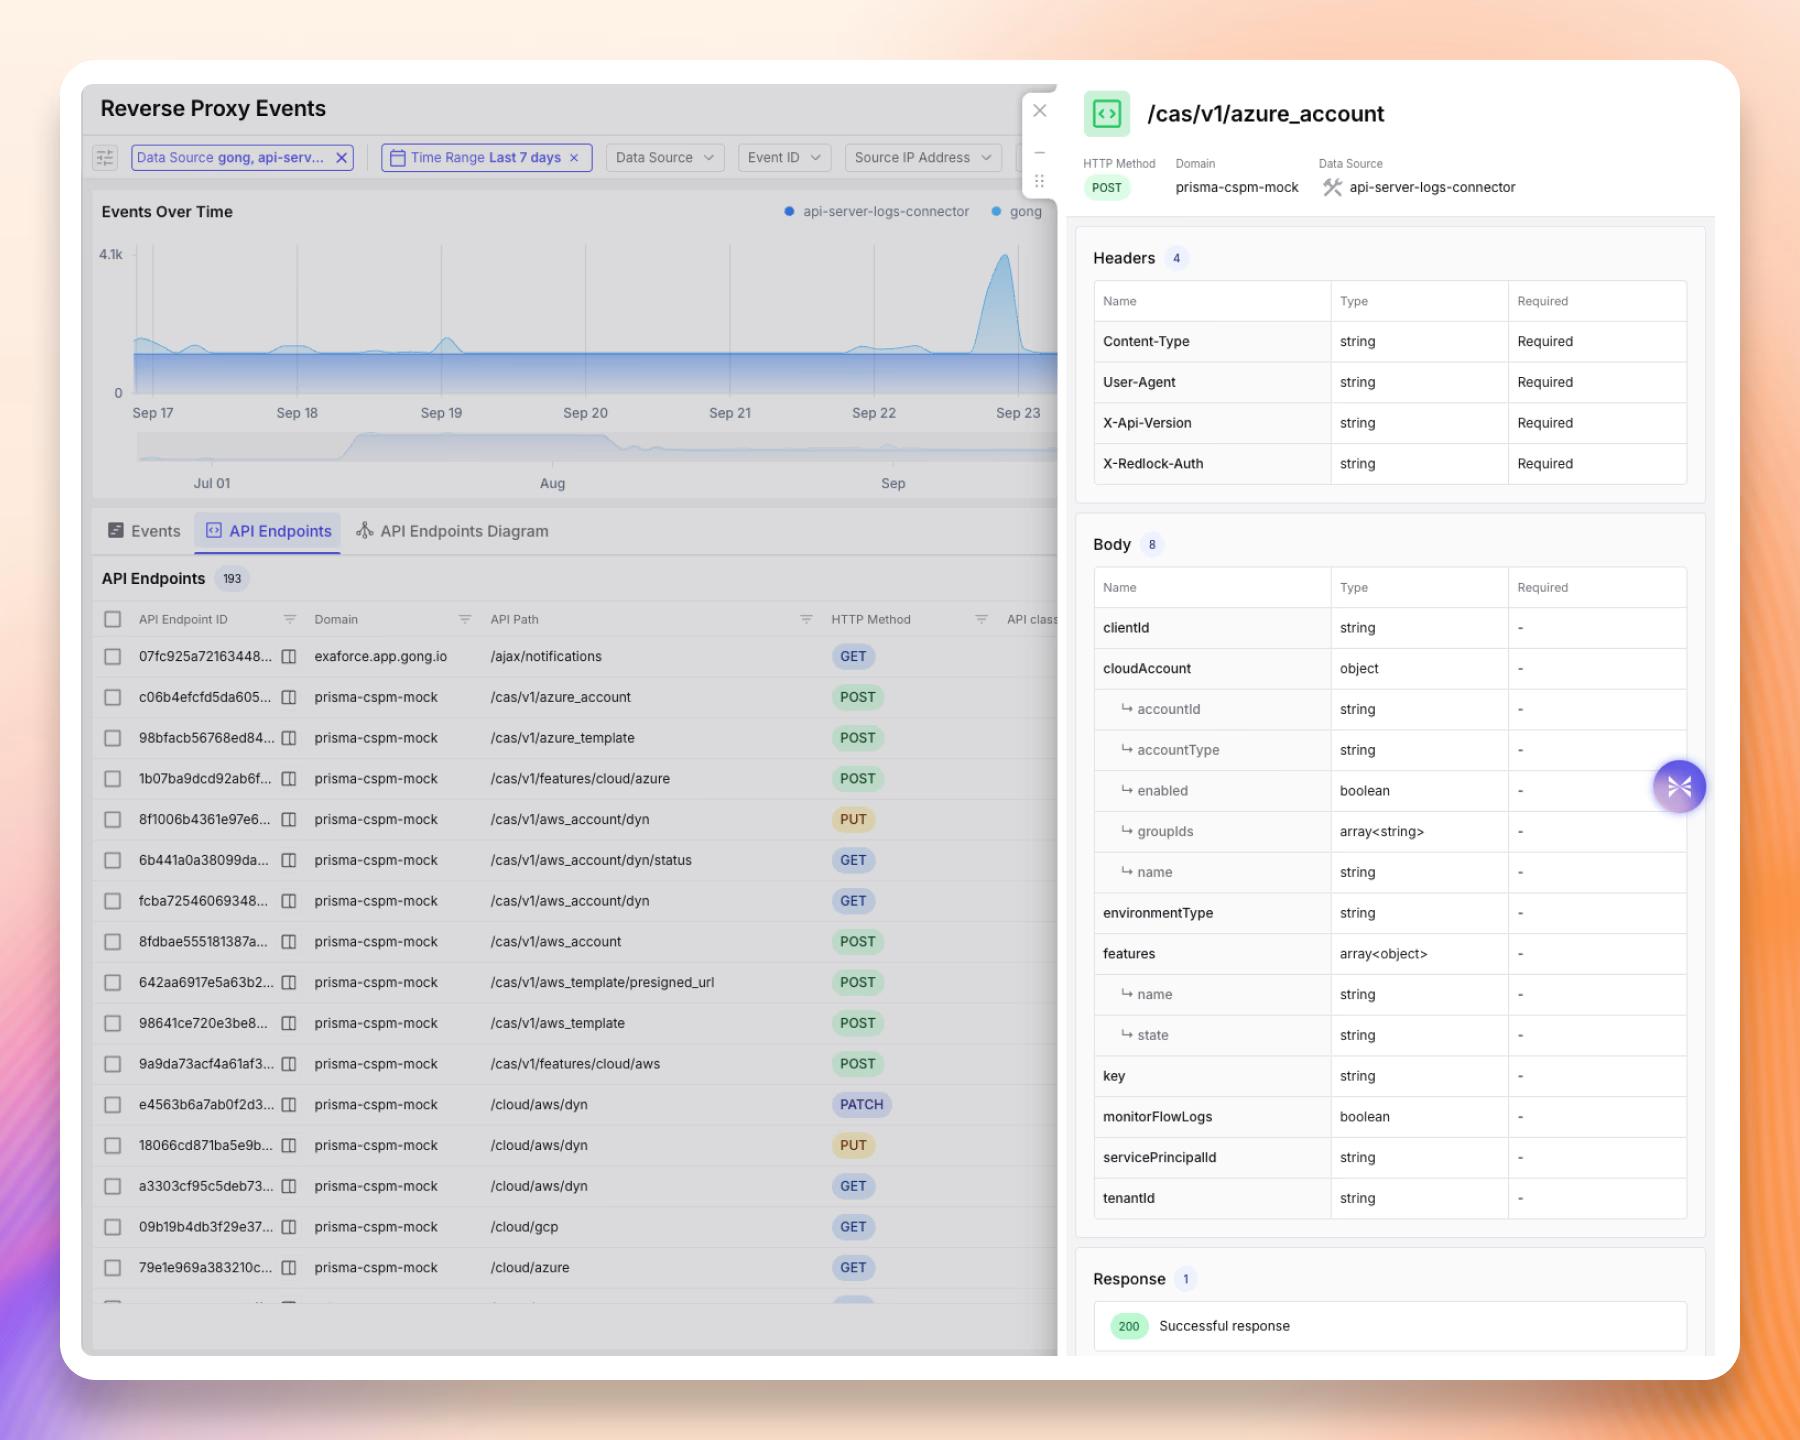
Then we go further. For every discovered endpoint, the system learns what “normal” looks like: which query parameters are expected, what types they should be, which headers are standard, what the request body looks like (where the proxy or API server logs it), and which response codes are typical.
The result is an automatically generated API contract per endpoint. Any request that deviates from the learned contract is flagged for an unknown parameter name, a value that doesn’t match the expected type, or an unfamiliar header. This gives the SOC visibility into API-layer activity that a raw log index can’t surface: parameters and value types an endpoint has never seen, scanning tools probing endpoints with unexpected headers, and API misuse patterns that stand out only against a per-endpoint baseline.
The analyst doesn’t need to understand the API’s implementation. The system learns the contract and surfaces the deviations.
The learned contract for one endpoint: the headers it expects (Content-Type, User-Agent, X-Api-Version), each body field with its type and whether it’s required, and the expected response.
EDR Telemetry: What’s Happening on Your Endpoints
EDR telemetry doesn’t look like an audit log. Every event carries the “how” that no audit log captures.
We normalize telemetry from EDR providers and OS logging systems like Linux auditd into a process-centric model:
Identity on Device ran Process (with parent chain), which performed Action on Resource
Every event is tied to its process context: name, path, and command line, plus SHA-256 hash, publisher, and signing status where the source provides them, and the parent process chain that spawned the process. The parent chain is what lets you see that powershell.exe was launched by winword.exe, which was launched by outlook.exe — a textbook macro-based attack chain.
Events are classified into structured categories (process, network, file, registry, module, auth, logon, detection) with typed actions (Create, Launch, Delete, Elevate, Read, Terminate). Resources are typed too: files, directories, executables, scripts, registry keys, DNS domains, URLs, network endpoints, browser extensions, and even AI agent tools like MCP servers and IDE plugins. Typing is what lets a detection target script execution without enumerating extensions and interpreters, and what makes “which devices have run an MCP server, and under whose identity” a filter rather than a hunt.
Device context is rich: device type (laptop, server, container, Kubernetes node, VM), platform (Windows, Linux, macOS, iOS, Android), OS version, serial number, cloud provider, and hardware model. Each device maps to the users who operate it, and those users resolve to enterprise-wide identities. When a compromised device runs a suspicious process, you see not just the device, but the person, their department, their manager, and the other systems they have access to.
Vendor-native findings (CrowdStrike detections, Defender alerts, SentinelOne threats) are ingested with their MITRE ATT&CK tactic and technique mappings, severity scoring, and detection source metadata and correlated with the process chain and device context that produced them.
Proxy Logs: What’s Leaving Your Network
Forward proxy logs from Zscaler, Cato Networks, Netskope and similar providers capture outbound web access with full security context:
User on Device accessed URL through proxy, security policy Action applied
This model captures the security decisions your proxy made on outbound web traffic. DLP detection results, URL classification, application risk scores, malware categories, WAF decisions, and bandwidth policy enforcement are all part of the normalized event. Both source and destination IPs receive full geo-IP enrichment and threat reputation scoring. You will see not just where traffic went, but whether the destination is a known threat.
Firewall Logs: What’s Crossing Your Perimeter
Network firewall and IPS logs from Palo Alto Networks and Cato capture L4 flow data plus the application and threat context the firewall attaches to each session:
Source IP:Port connected to Destination IP:Port using Protocol, firewall rule Action applied, IPS detected Threat
This model tracks the full network picture: NAT translations with separate geo-IP enrichment on the pre- and post-NAT addresses, application identification, session volume metrics (bytes sent/received, packets, duration), and IPS detections with threat categorization. The system correlates a firewall block with the identity behind it and the destination that identity was trying to reach.
The Enrichment Layer: Context Built In, Not Bolted On
Across every semantic model, events are automatically enriched as they flow through the pipeline. Enrichment isn’t a separate SOAR playbook or an analyst-triggered lookup, but it’s built into the transformation.
Geo-IP and Threat Intelligence
Every public IP address — source, destination, NAT-translated — is resolved to city, country, ASN, lat/long coordinates, and geo-accuracy. Threat reputation feeds classify known malicious IPs, VPN providers, Tor exit nodes, and anonymous proxies. This enrichment happens on every event across every data type, not just the ones an analyst decides to investigate.
User Agent Intelligence
Across SaaS events, access logs, and proxy traffic, every user agent string is parsed and classified into one of 100+ recognized client types. Take this raw user agent:
It isn’t treated as opaque text. We extract client=aws_cli, version=2.11.20, language=python 3.11.3, OS=macOS, architecture=x86_64, and command=iam.list-roles (the specific AWS CLI command being run).
The same deep parsing applies to Terraform (with provider versions), the AWS SDKs (boto3, Go, Java, Node, Rust, Ruby, .NET, PHP), Kubernetes tools (kubectl, kubelet, Argo CD), CI/CD clients (GitHub Actions runners), developer tools (Postman, curl, axios), and offensive tools such as Stratus Red Team.
User agents go from searchable text to structured security telemetry. A request doesn’t come from “a browser”; it comes from Chrome 125 on macOS, or from boto3 1.28.17 on Linux with Python 3.9. Combined with per-user baselines of which clients each person normally uses, a sudden shift in tooling becomes a detection signal.
Session Construction
Events are grouped into sessions, which are temporal clusters of activity by the same principal. Sessions capture duration, event count, whether sensitive actions were performed, and whether a human or a sub-principal drove the activity. Session construction turns a stream of individual events into coherent units of activity that detection can reason about.
What This Foundation Enables
These semantic models are not the end product. They’re the foundation that everything else is built on.
Without a shared semantic model, you can’t build a behavioral baseline for a user across Okta, GitHub, and Slack, because you don’t even know that the three event streams refer to the same person, or that their events represent comparable actions.
Without sub-principal labeling, you can’t tell the difference between a human insider threat and a scheduled backup job, so your detections generate noise on one and miss the other.
Without API endpoint discovery, you can’t know what “normal” looks like for your APIs, because you don’t have APIs, you have URLs.
Without user agent parsing, a python-requests call from a finance user’s account is a string you can search for, not a client you can baseline that user against, because it’s all just text.
Without a shared identity across EDR, proxy, and firewall events, a blocked outbound connection and the device and person behind it are three separate records, and the analyst has to make the correlation.
Together, the semantic models and the enrichment built into them are what make possible context-rich detection, cross-source correlation, and a grounded AI that reasons over structured context instead of raw log text. In the next post, we’ll show how Exaforce uses this foundation for detection: every signal evaluated against the full context of the identity, resource, location, device, and behavioral history.
Next: Part 3 — Context-Rich Detection: Using Everything We Know