
Intro
Upon a confirmed compromise on the machine, the security team and the company altogether, needs to be certain of the attack that happened, the scope of it, the access the attacker got and the access they still retain. This is important, as while cleaning up the compromised machines, the attacker might have gotten another type of access on the entire environment, and the only evidence to that attack, is the compromised machine.
Getting the raw forensic artifacts off an endpoint is itself a bottleneck. The evidence that answers those questions is scattered across dozens of locations, such as registry hives, event logs across many channels, browser history databases, prefetch, shimcache, amcache, scheduled tasks, WMI subscriptions, and more. Traditionally, collecting it means either imaging the disk or having an analyst remote onto the machine and run a patchwork of tools by hand, frequently after the host has already been pulled off the network. Each of those paths is slow, requires scarce specialist time, and every manual touch risks tainting the very evidence being collected.
In cases like this, a forensics team is hired to analyze the system, sometimes partial or the entire environment, and give a report of the attack and the current situation. And most often that takes more than 24 hours which is precious time in the middle of an incident. So, we decided to take a look at how we can utilize AI Agents to gather and analyze forensics data from endpoints within minutes of an alert to understand the scope and impact of a compromise shaving critical time during an incident.
Why endpoint forensics is hard to do fast
The hard part was never the analysis. That is difficult of course, but itʼs getting to the evidence before itʼs gone. A few things fight you at the same time.
The evidence is scattered and in formats nobody reads by hand. What actually happened on a machine is spread across dozens of unrelated sources, such as registry hives, event logs across a half-dozen channels, PowerShell transcripts, prefetch, shimcache, amcache, BAM/DAM, UserAssist, jump lists, browser history databases, scheduled tasks, WMI subscriptions, and more. Each lives in its own location and its own binary or database format, and most require a dedicated parser to turn into something human-readable. Pulling a complete picture means knowing all of these exist, collecting each one correctly, and parsing each one, before a single question about the attack can be answered.
Much of it is volatile, so the clock starts immediately. Active network connections, running processes, DNS and ARP caches, and logged-on sessions reflect the state of the machine right now and are gone or overwritten shortly after. Event logs roll over. Caches get evicted. The longer the gap between “we think this was compromised” and the moment data is captured, the more of the attackerʼs activity has already aged out of the record, which is exactly the opposite of what you want when the incident is still live.
Reaching the endpoint is its own obstacle. The machine may be remote, off the corporate network, already contained and isolated, or simply a laptop thatʼs asleep somewhere. Traditional collection assumes an analyst can get hands on it, either physically to image the disk or interactively over a remote session, and during an active incident that access is often the slowest part of the whole process. Containment and investigation also pull in opposite directions: the fastest way to stop the bleeding is to pull the box off the network, but thatʼs also the box holding the only evidence of what the attacker did.
Every manual touch taints the scene. Logging in, mounting a drive, running a tool, even opening a file all change timestamps, generate new events, and consume resources on the very system youʼre trying to read. Each action an analyst takes adds noise that later has to be separated from the attackerʼs activity, and careless collection can overwrite the artifact you were about to collect.
It doesnʼt scale, and the expertise is scarce. A real intrusion rarely touches one machine, but deep forensic collection and analysis is slow, manual, and specialist work. Forensics talent is expensive and in short supply, and bringing in an outside firm adds days just to scope and spin up. Doing this across ten or fifty hosts by hand simply isnʼt feasible inside the window where the answers still matter.
And even once the data is in hand, reading it takes hours. A single endpoint produces an enormous volume of context-rich records. A human analyst has to wade through all of it, correlate across sources, and reconstruct a timeline manually, and that reading time is pure latency between collection and an answer the response team can act on.
As a result, in the hours or days it takes to collect, parse, and read endpoint evidence the traditional way, the attacker may already have used their access to establish a quieter second foothold elsewhere, and the wiped machine was the only witness to it. This gap is what we want to close.
Exaforce AI-powered remote automated forensics agent
When building an remote and automated AI-powered Forensics agent, four things need to be considered:
- The data the script will be collecting
- The method using which the script will be executed and data will be collected remotely
- The events the script will generate and how much the system will be tainted by this task
- The size of the script and the data collected, which will then be pushed to the agent for scanning
The data each script collects and the events it generates on execution are detailed in the collection scripts that follow. As for the remote execution and retrieval of collection, we decided to utilize EDR solutions' remote execution features.
The solutions used in our workflows are CrowdStrike, SentinelOne and Microsoft Defender EDR. They have remote execution technologies, allowing for custom commands and scripts to be executed, as well as other helping commands, such as downloading and uploading files, and doing all of them through an API, allowing for easier connection between our product and their solutions.
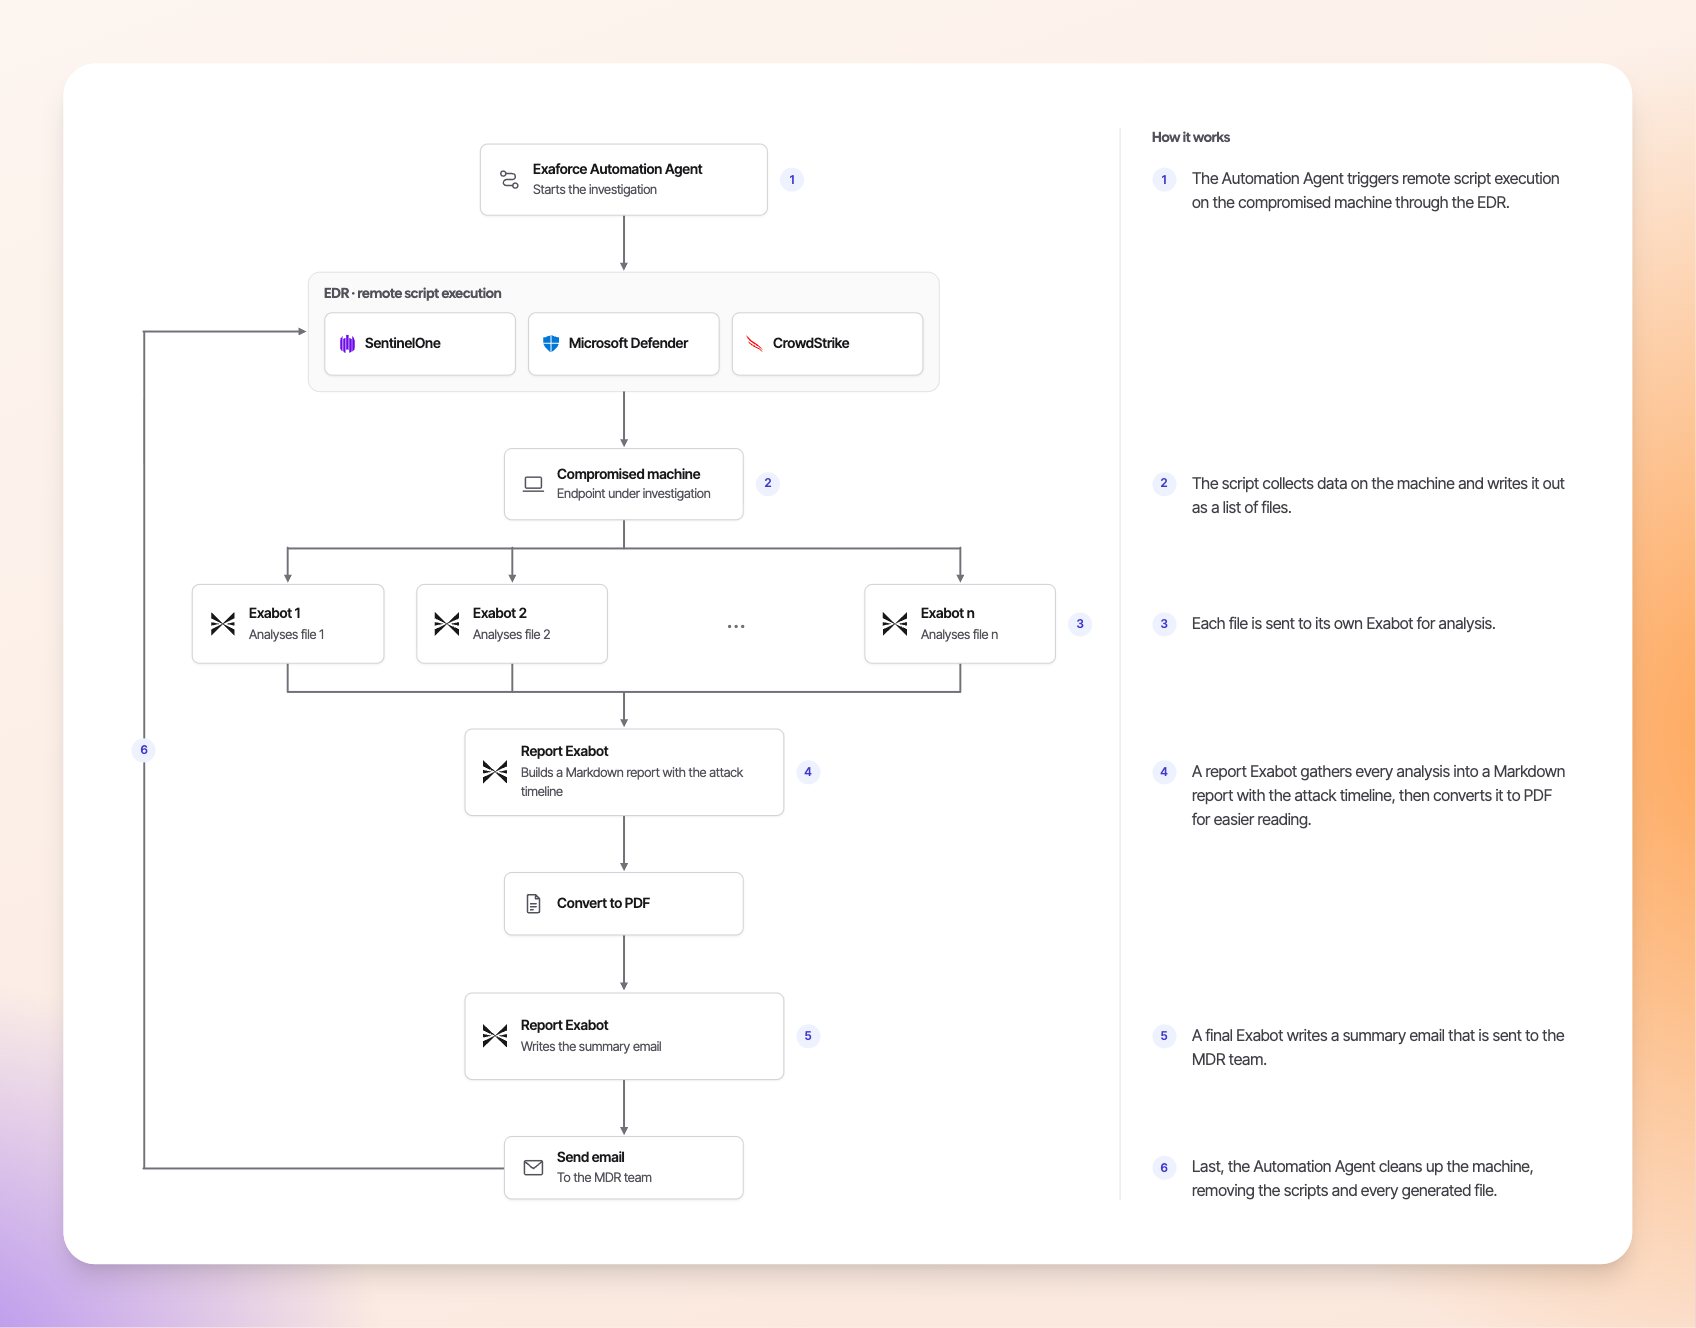
The files downloaded are then sent to an Exaforce Automation Agent workflow, which sends each one of the files to its Exabot. Exabot has previous information about the machine, such as the identities that access it, events from the machine, Threat Findings and Incidents and posture management. That, together with the information gathered from the machines, allows for a clearer analysis of the attack.
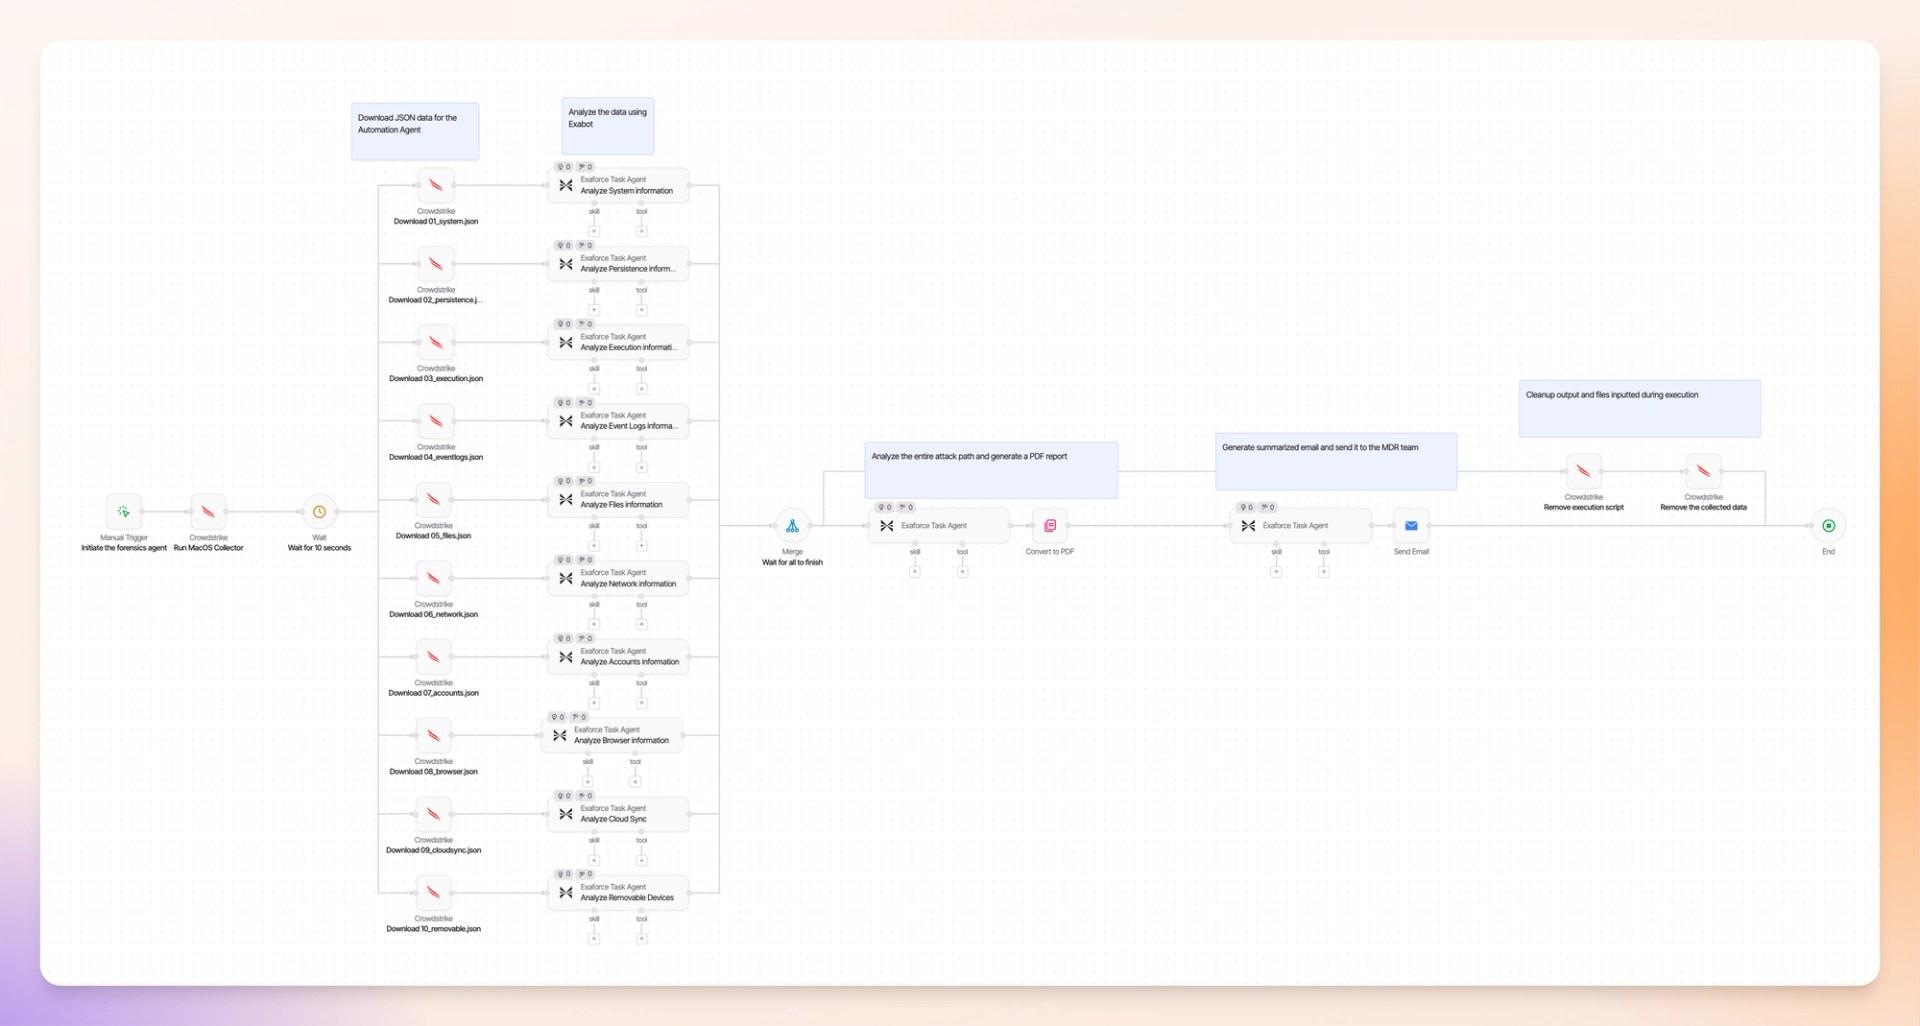
To lower the possibility of hallucinations due to high value of the data provided, each of the file is passed to a specific prompt, tailored to the data that will be given, providing output for the attacks that can happen and events generated on that specific type of triage.
Then, a final agent collects all of the information provided by each of the separate agents, cross references once more with the previous context and generates a report containing the attack timeline, assessment of potential attacks that happened, attack reconstruction, key findings and indicators.
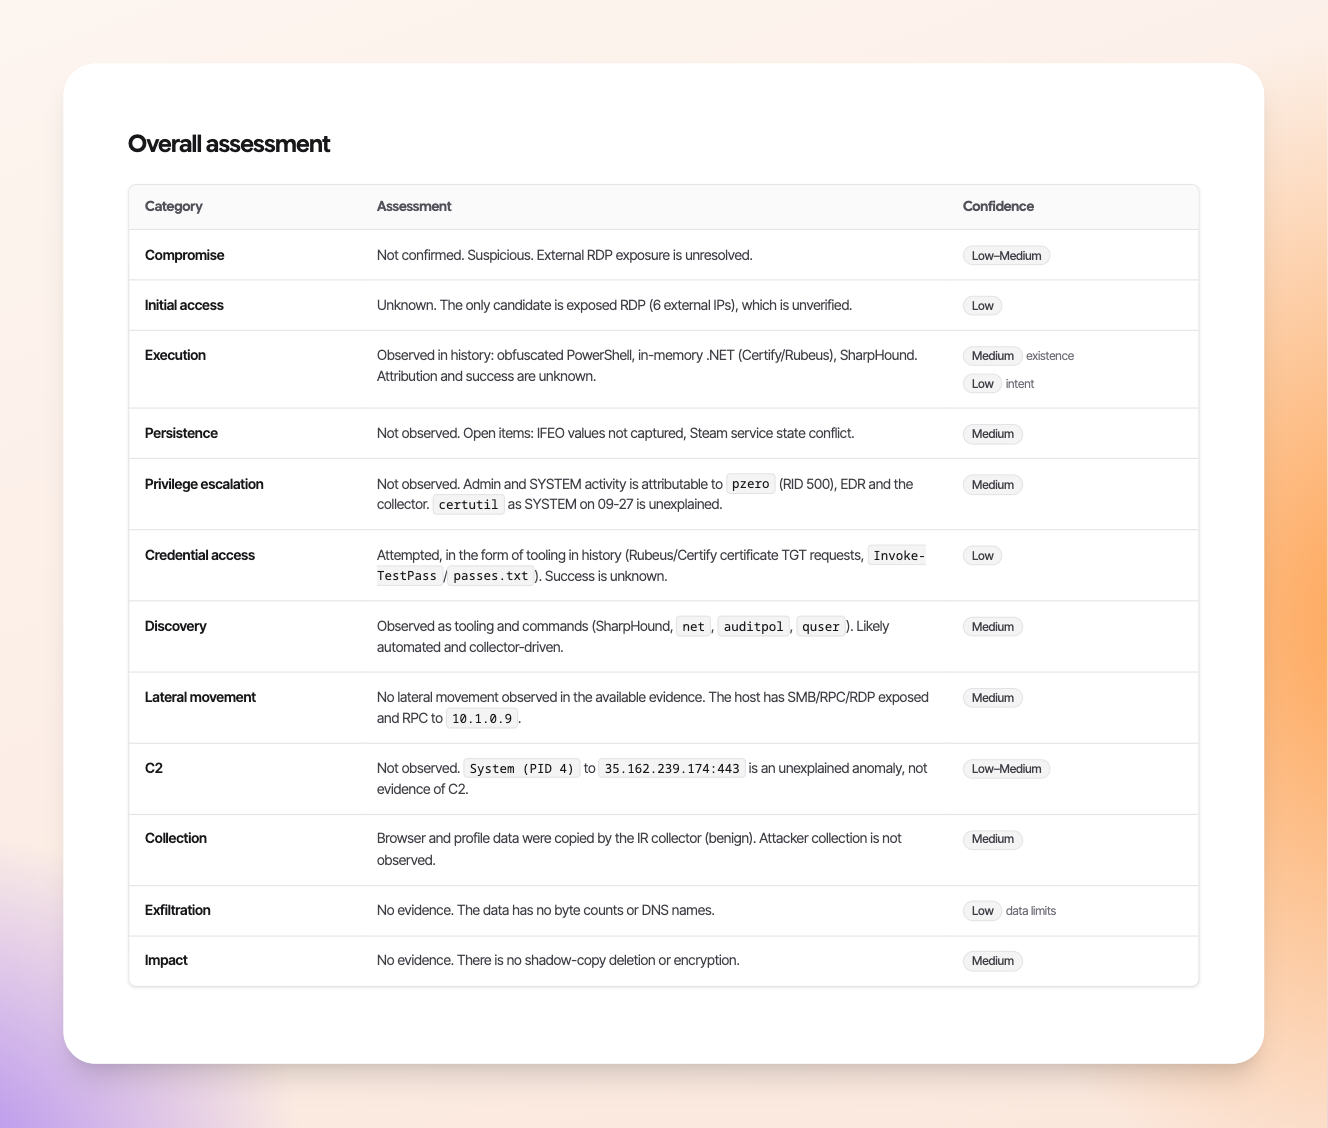
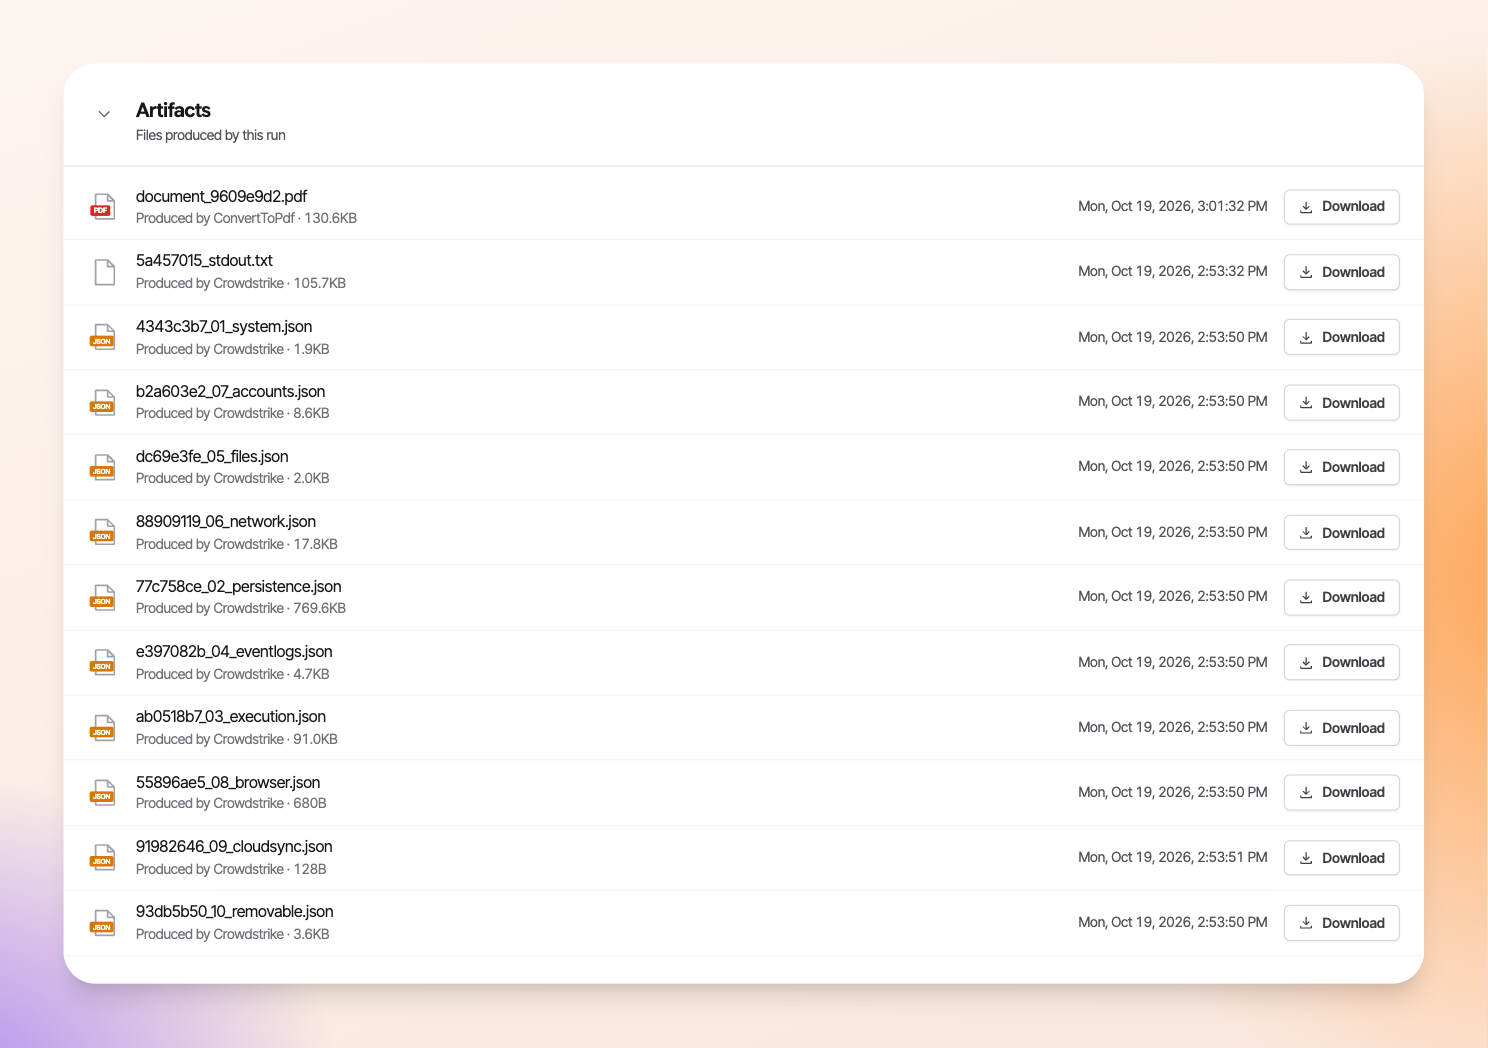
The team handling the attack on the client's side, will be able to have a clear overview of the attack that happened on the compromised device. For cases when a human eye is requested as a second verification of the attacks, the agent will also keep a copy of the files downloaded, so the user can see the data being collected and analyzed, without touching the machine another time.
Forensics gathering script
When deciding to do automated forensics on a compromised device, it is important to know what information will be gathered, by trying to understand what information is important.
In any endpoint attack, there will be an initial access point. After that, depending on the goal of the attacker, there might be some enumeration, horizontal lateral movement between processes and identities within the machine, privilege escalation and persistence. There is no guarantee that all of them will be executed, due to as mentioned before, the goal of the attacker or security systems interfering with the attack.
As such, what is important to know as forensics analysts, is to know how the attacker managed to get access (by gathering execution events, such as CMD and PowerShell execution commands, services being created, applications being executed, as well as getting an idea on how the malicious payload might have entered the system though Browser and Network information gathering.
Then, again, during the Lateral Movement and Privilege Escalation, either horizontal or vertical, we need to know about the processes, services, applications and commands being executed, as well as Network connections to services inside or outside the system. EventLogs do help with security related events, such as user creation or modification, process creation, scheduled task creation and modification, service tampering, etc. The same information is also needed for persistence, as many techniques used in execution and privilege escalation can be used as persistence mechanisms. During persistence though, we care not only about execution from low level access identities, but also high privileged ones, up to machine and kernel level execution.
Windows
For windows, the script will gather information about PowerShell History and logs, as well as it's logging configuration, CMD history, network connection, including SSH configurations on the system, execution related data, system and process related data, important event logs and browser downloads, extensions and history.
$Global:ModuleResults = New-Object System.Collections.Generic.List[Object]
$Global:JsonData = [ordered]@{
    CaseInfo       = [ordered]@{}
    PowerShell     = [ordered]@{}
    CommandHistory = [ordered]@{}
    SSH            = [ordered]@{}
    IR             = [ordered]@{}
    Persistence    = [ordered]@{}
    Network        = [ordered]@{}
    System         = [ordered]@{}
    Processes      = [ordered]@{}
    EventLogs      = [ordered]@{}
    Browser        = [ordered]@{}
    ModuleResults  = @()
}
Browser data. For Chrome, Edge, Firefox, and Brave, across every user and profile, the script copies the History database (which also holds download records) and each installed extension's manifest.json. These raw files are kept untouched. A final step then parses the copied History database into URL rows and the manifests into structured JSON, so extension permissions and visited URLs can be read without opening a separate tool.
# Browser modules
Invoke-Module -Name 'Browser.History.Chrome'     -FunctionName 'Collect-BrowserHistoryChrome'     -DestDir (Join-Path $WorkDir 'Browser\History\Chrome')
Invoke-Module -Name 'Browser.History.Edge'       -FunctionName 'Collect-BrowserHistoryEdge'       -DestDir (Join-Path $WorkDir 'Browser\History\Edge')
Invoke-Module -Name 'Browser.History.Firefox'    -FunctionName 'Collect-BrowserHistoryFirefox'    -DestDir (Join-Path $WorkDir 'Browser\History\Firefox')
Invoke-Module -Name 'Browser.History.Brave'      -FunctionName 'Collect-BrowserHistoryBrave'      -DestDir (Join-Path $WorkDir 'Browser\History\Brave')
Invoke-Module -Name 'Browser.Downloads.Chrome'   -FunctionName 'Collect-BrowserDownloadsChrome'   -DestDir (Join-Path $WorkDir 'Browser\Downloads\Chrome')
Invoke-Module -Name 'Browser.Downloads.Edge'     -FunctionName 'Collect-BrowserDownloadsEdge'     -DestDir (Join-Path $WorkDir 'Browser\Downloads\Edge')
Invoke-Module -Name 'Browser.Downloads.Firefox'  -FunctionName 'Collect-BrowserDownloadsFirefox'  -DestDir (Join-Path $WorkDir 'Browser\Downloads\Firefox')
Invoke-Module -Name 'Browser.Downloads.Brave'    -FunctionName 'Collect-BrowserDownloadsBrave'    -DestDir (Join-Path $WorkDir 'Browser\Downloads\Brave')
Invoke-Module -Name 'Browser.Extensions.Chrome'  -FunctionName 'Collect-BrowserExtensionsChrome'  -DestDir (Join-Path $WorkDir 'Browser\Extensions\Chrome')
Invoke-Module -Name 'Browser.Extensions.Edge'    -FunctionName 'Collect-BrowserExtensionsEdge'    -DestDir (Join-Path $WorkDir 'Browser\Extensions\Edge')
Invoke-Module -Name 'Browser.Extensions.Firefox' -FunctionName 'Collect-BrowserExtensionsFirefox' -DestDir (Join-Path $WorkDir 'Browser\Extensions\Firefox')
Invoke-Module -Name 'Browser.Extensions.Brave'   -FunctionName 'Collect-BrowserExtensionsBrave'   -DestDir (Join-Path $WorkDir 'Browser\Extensions\Brave')
Execution evidence. This answers what ran on the machine and when. The script reads UserAssist (GUI program launches, with run counts and last-run times decoded from the binary registry data), BAM and DAM (the last execution time of each executable, per user SID), and Amcache (the application inventory, read by loading a copy of Amcache.hve as an offline registry hive). It also reads Shimcache, Prefetch, and SRUM, but only partly. For Shimcache it pulls out the executable paths embedded in the raw cache. For Prefetch it records file names, sizes, and timestamps. For SRUM it records only metadata about the database files. All three can be parsed in full offline.
User activity. Recent-files shortcuts, Jump Lists, and the .lnk files on each user's Desktop and Start Menu are collected for every profile on the machine. The script extracts the target paths from them, which shows what a user opened, including files on removable or network storage that no longer exist.
# Execution evidence
Invoke-DataModule -Name 'IR.RecentFiles' -FunctionName 'Get-RecentFilesData' -TargetPath 'IR.RecentFiles'
Invoke-DataModule -Name 'IR.JumpLists'   -FunctionName 'Get-JumpListsData'   -TargetPath 'IR.JumpLists'  -TimeoutSec $LongTimeoutSec
Invoke-DataModule -Name 'IR.LNK'         -FunctionName 'Get-LnkFilesData'    -TargetPath 'IR.LNK'        -TimeoutSec $LongTimeoutSec
Invoke-DataModule -Name 'IR.UserAssist'  -FunctionName 'Get-UserAssistData'  -TargetPath 'IR.UserAssist' -TimeoutSec $LongTimeoutSec
Invoke-DataModule -Name 'IR.BAM'         -FunctionName 'Get-BAMData'         -TargetPath 'IR.BAM'
Invoke-DataModule -Name 'IR.DAM'         -FunctionName 'Get-DAMData'         -TargetPath 'IR.DAM'
Invoke-DataModule -Name 'IR.Prefetch'    -FunctionName 'Get-PrefetchData'    -TargetPath 'IR.Prefetch'
Invoke-DataModule -Name 'IR.Amcache'     -FunctionName 'Get-AmcacheData'     -TargetPath 'IR.Amcache'    -TimeoutSec $LongTimeoutSec
Invoke-DataModule -Name 'IR.Shimcache'   -FunctionName 'Get-ShimcacheData'   -TargetPath 'IR.Shimcache'
Invoke-DataModule -Name 'IR.SRUM'        -FunctionName 'Get-SRUMData'        -TargetPath 'IR.SRUM'       -TimeoutSec $LongTimeoutSec
Command and shell history. For PowerShell it collects each user's PSReadLine history (up to the last 1,000 lines), the logging policy settings (script block logging, module logging, transcription), and the locations and sizes of any transcript files. For cmd.exe it collects the AutoRun registry entries, a common persistence trick, and notes that cmd keeps no history on disk. SSH data includes the server and client configs, authorized_keys, known_hosts, and public keys only. Private keys are never collected.
# Powershell related data
Invoke-DataModule -Name 'PowerShell.History'      -FunctionName 'Get-PowerShellHistoryData'      -TargetPath 'PowerShell.History'
Invoke-DataModule -Name 'PowerShell.Transcripts'   -FunctionName 'Get-PowerShellTranscriptsData'   -TargetPath 'PowerShell.Transcripts'
Invoke-DataModule -Name 'PowerShell.LoggingConfig' -FunctionName 'Get-PowerShellLoggingConfigData' -TargetPath 'PowerShell.LoggingConfig'

# Console Terminal data
Invoke-DataModule -Name 'CommandHistory'           -FunctionName 'Get-CmdHistoryData'              -TargetPath 'CommandHistory'

# SSH data
Invoke-DataModule -Name 'SSH'                      -FunctionName 'Get-SSHConfigData'               -TargetPath 'SSH'
Persistence. This covers the places an attacker would use to survive a reboot. The script collects every scheduled task, Run and RunOnce keys (machine and per-user), Startup folder contents, all services (path, start mode, account), and all drivers. It also reads a curated set of registry auto-start locations: Winlogon, Image File Execution Options (used for debugger hijacking), Browser Helper Objects, and Session Manager. WMI event subscriptions (filters, consumers, and their bindings) are collected, since they are a common fileless persistence mechanism.
# Persistence data
Invoke-DataModule -Name 'Persistence.ScheduledTasks' -FunctionName 'Get-ScheduledTasksData'     -TargetPath 'Persistence.ScheduledTasks' -TimeoutSec $LongTimeoutSec
Invoke-DataModule -Name 'Persistence.Startup'        -FunctionName 'Get-StartupPersistenceData' -TargetPath 'Persistence.Startup'
Invoke-DataModule -Name 'Persistence.Services'       -FunctionName 'Get-ServicesData'            -TargetPath 'Persistence.Services'
Invoke-DataModule -Name 'Persistence.Drivers'        -FunctionName 'Get-DriversData'             -TargetPath 'Persistence.Drivers'
Invoke-DataModule -Name 'Persistence.Registry'       -FunctionName 'Get-RegistryPersistenceData' -TargetPath 'Persistence.Registry'
Invoke-DataModule -Name 'Persistence.WMI'            -FunctionName 'Get-WMIPersistenceData'      -TargetPath 'Persistence.WMI' -TimeoutSec $LongTimeoutSec
Network state. The script records active TCP connections and UDP endpoints with their owning process IDs. It also collects the DNS cache, ARP table, routing table, and Windows Firewall rules. Each of these has a fallback to the classic command-line tool (netstat, ipconfig /displaydns, arp, route, netsh) if the PowerShell cmdlet is unavailable.
# Network data
Invoke-DataModule -Name 'Network.Firewall' -FunctionName 'Get-FirewallRulesData' -TargetPath 'Network.Firewall'
Invoke-DataModule -Name 'Network.DNS'      -FunctionName 'Get-DNSCacheData'      -TargetPath 'Network.DNS'
Invoke-DataModule -Name 'Network.ARP'      -FunctionName 'Get-ARPCacheData'      -TargetPath 'Network.ARP'
Invoke-DataModule -Name 'Network.Routes'   -FunctionName 'Get-RouteTableData'    -TargetPath 'Network.Routes'
Invoke-DataModule -Name 'Network.Netstat'  -FunctionName 'Get-NetstatData'       -TargetPath 'Network.Netstat'
Host context. This gives the picture around everything else:
- Currently logged-on users.
- Members of the local Administrators group.
- Installed software, read from the registry uninstall keys, which avoids the slow and intrusive Win32_Product class.
- Environment variables at process, machine, and user scope.
- Mounted volumes.
- The hosts file, with comments stripped.
- USB device history, from the USBSTOR and USB registry trees, MountedDevices, and the tail of setupapi.dev.log.
# System related data
Invoke-DataModule -Name 'System.LoggedOnUsers'     -FunctionName 'Get-LoggedOnUsersData'        -TargetPath 'System.LoggedOnUsers'
Invoke-DataModule -Name 'System.LocalAdmins'       -FunctionName 'Get-LocalAdminsData'          -TargetPath 'System.LocalAdmins'
Invoke-DataModule -Name 'System.InstalledSoftware' -FunctionName 'Get-InstalledSoftwareData'    -TargetPath 'System.InstalledSoftware'
Invoke-DataModule -Name 'System.Environment'       -FunctionName 'Get-EnvironmentVariablesData' -TargetPath 'System.Environment'
Invoke-DataModule -Name 'System.USB'               -FunctionName 'Get-USBHistoryData'           -TargetPath 'System.USB'
Invoke-DataModule -Name 'System.MountedVolumes'    -FunctionName 'Get-MountedVolumesData'       -TargetPath 'System.MountedVolumes'
Invoke-DataModule -Name 'System.HostsFile'         -FunctionName 'Get-HostsFileData'            -TargetPath 'System.HostsFile'
Processes. One module records the running process list: PID, parent PID, name, path, and start time. A second records every process's full command line. Together they let a responder rebuild the process tree and see exactly how each program was launched.
# Process information
Invoke-DataModule -Name 'Processes.List'         -FunctionName 'Get-RunningProcessesData'   -TargetPath 'Processes.List'
Invoke-DataModule -Name 'Processes.CommandLines' -FunctionName 'Get-ProcessCommandLinesData' -TargetPath 'Processes.CommandLines'
Events, filtered rather than exported. The script queries each channel for the last 7 days using a short allow-list of Event IDs, capped per channel, newest first.
- Security: log clearing (1102), logons and failed logons (4624, 4625), explicit-credential use (4648), special privileges (4672), process creation (4688), service and scheduled-task creation and changes (4697–4702), account and group management (4720–4767), RDP-related activity (4778, 4779), firewall changes (4964), and network share access (5140, 5145).
- System: new service installs (7045), service state changes (7040), log clearing (104), shutdowns and restarts, and unexpected shutdowns (6008).
- PowerShell: script block and pipeline execution (4103, 4104).
- Sysmon: process creation, network connections, image loads, remote threads, and related events (IDs 1, 3, 6, 8, 15, 17, 18, 22, 23, 25).
- Defender: malware detections, remediation actions, and configuration or real-time-protection changes.
- Application: Critical and Error events only, because that channel has no consistent security IDs.
# Events generated
Invoke-DataModule -Name 'EventLogs.Security'    -FunctionName 'Get-EventLogSecurityData'    -TargetPath 'EventLogs.Security'    -TimeoutSec $LongTimeoutSec
Invoke-DataModule -Name 'EventLogs.System'      -FunctionName 'Get-EventLogSystemData'      -TargetPath 'EventLogs.System' -TimeoutSec $LongTimeoutSec
Invoke-DataModule -Name 'EventLogs.Application' -FunctionName 'Get-EventLogApplicationData' -TargetPath 'EventLogs.Application' -TimeoutSec $LongTimeoutSec
Invoke-DataModule -Name 'EventLogs.PowerShell'  -FunctionName 'Get-EventLogPowerShellData'  -TargetPath 'EventLogs.PowerShell'  -TimeoutSec $LongTimeoutSec
Invoke-DataModule -Name 'EventLogs.Sysmon'      -FunctionName 'Get-EventLogSysmonData'      -TargetPath 'EventLogs.Sysmon' -TimeoutSec $LongTimeoutSec
Invoke-DataModule -Name 'EventLogs.Defender'    -FunctionName 'Get-EventLogDefenderData'    -TargetPath 'EventLogs.Defender'    -TimeoutSec $LongTimeoutSec
Upon execution, a metadata JSON will be created, which will keep information on the system, script, user executing the script and the time of start, end and duration in-between them.
# Forensics Case information data
$EndTime = Get-Date
$Global:JsonData.CaseInfo = [ordered]@{
    CaseName        = $CaseName
    Hostname        = $HostnameStr
    RunAsUser       = $UsernameStr
    ScriptVersion   = $ScriptVersion
    StartTimeUtc    = $StartTime.ToUniversalTime().ToString('o')
    EndTimeUtc      = $EndTime.ToUniversalTime().ToString('o')
    DurationSeconds = [math]::Round(($EndTime - $StartTime).TotalSeconds, 1)
}
$Global:JsonData.ModuleResults = $Global:ModuleResults.ToArray()
The entire JSON output of the data collected will be stored into one large JSON, which can be used for manual analysis of the data.
$JsonOutPath = 'C:\Windows\Temp\IR_Data.json' #Join-Path $WorkDir 'IR_Data.json'
try {
    ($Global:JsonData | ConvertTo-Json -Depth 12 -ErrorAction Stop) | Out-File -FilePath $JsonOutPath -Encoding utf8
    Write-Log 'INFO' "Wrote consolidated JSON: $JsonOutPath"
} catch {
    Write-Log 'ERROR' "Failed to write consolidated JSON: $($_.Exception.Message)"
}
Then, to allow for analysis of data separately by the agents and an easier download of those data from the machine, the large JSON is split into 10 separate ones, which are downloaded by the machine's agent.
$JsonOutputDir = "C:\Windows\Temp\IR_Data"

if (Test-Path -LiteralPath $JsonOutputDir) {
Remove-Item -LiteralPath $JsonOutputDir -Recurse -Force
}

mkdir $JsonOutputDir

Write-JsonFile -InputObject $Global:JsonData.Powershell     -Depth 5 -Path (Join-Path $JsonOutputDir "Powershell.json")
Write-JsonFile -InputObject $Global:JsonData.CommandHistory -Depth 5 -Path (Join-Path $JsonOutputDir "CommandHistory.json")
Write-JsonFile -InputObject $Global:JsonData.SSH            -Depth 5 -Path (Join-Path $JsonOutputDir "SSH.json")
Write-JsonFile -InputObject $Global:JsonData.IR             -Depth 5 -Path (Join-Path $JsonOutputDir "IR.json")
Write-JsonFile -InputObject $Global:JsonData.Persistence    -Depth 5 -Path (Join-Path $JsonOutputDir "Persistence.json")
Write-JsonFile -InputObject $Global:JsonData.Network        -Depth 5 -Path (Join-Path $JsonOutputDir "Network.json")
Write-JsonFile -InputObject $Global:JsonData.System         -Depth 5 -Path (Join-Path $JsonOutputDir "System.json")
Write-JsonFile -InputObject $Global:JsonData.Processes      -Depth 5 -Path (Join-Path $JsonOutputDir "Processes.json")
Write-JsonFile -InputObject $Global:JsonData.EventLogs      -Depth 5 -Path (Join-Path $JsonOutputDir "EventLogs.json")
Write-JsonFile -InputObject $Global:JsonData.Browser        -Depth 5 -Path (Join-Path $JsonOutputDir "Browser.json")
macOS
MacOS collection follows the same logic. We collect 10 types of data into 10 files, plus one metadata file.
main() {
--snip--
for m in "${MODULES[@]}"; do
case $m in
system) mod_system ;;
persistence) mod_persistence ;;
execution) mod_execution ;;
eventlogs) mod_eventlogs ;;
files) mod_files ;;
network) mod_network ;;
accounts) mod_accounts ;;
browser) mod_browser ;;
cloudsync) mod_cloudsync ;;
removable) mod_removable ;;
*) print -u2 "[!] unknown module: $m" ;;
esac
done
write_manifest
log "done. $(ls -1 "$OUTDIR"/*.json 2>/dev/null | wc -l | tr -d ' ') files in $OUTDIR"
print -- "$OUTDIR"
}
main "$@"
Same as before, we need to know what happened during initial access, any enumeration, lateral movement, privilege escalation and persistence, in order to know what the attacker did.
Conclusions
Having a compromised machine is never just about that one machine. The real risk is what the attacker did from it and what they still hold elsewhere in the environment, and the clock starts the moment the box is cleaned up. Traditional forensics answers this well but is slow and costly, and in that gap the attacker may already be building a quieter second foothold that the now-wiped evidence was the only witness to.
This workflow shows that the heavy front end of that investigation can be automated without losing rigor. By collecting a deliberately chosen set of artifacts across execution, persistence, lateral movement, privilege escalation, network, and browser activity on both Windows and macOS, and delivering it in a consistent structured form, we hand the AI exactly what it handles well: large volumes of context-rich data a human would need hours just to read. Splitting it into focused slices, pairing each with a tailored prompt, and grounding the analysis in the Exabot's prior context about the machine keeps hallucinations low, while the final cross-referencing pass turns ten narrow views into one timeline and reconstruction a response team can act on.
What makes it practical is that collection stays light-touch, remote execution rides on EDR tooling the organization already trusts, and the raw files are preserved beside the report so a human can verify any conclusion without touching the machine again. The result isn't a replacement for a forensics team but a force multiplier, which compresses the time between "we think this was compromised" and "here is what happened, the scope, and what the attacker may still have", which is exactly the window where fast, accurate answers matter most.