Part 3 of a series on rethinking security operations from the ground up.
In Part 2, we showed how Exaforce transforms raw logs into purpose-built semantic models — SaaS events with sub-principal labeling, access logs with auto-discovered API contracts, EDR telemetry with full process chains, and more.
But semantic models are only half the picture. They structure what happened. To decide whether it matters, you need to know the context surrounding it: who the person is, what they have access to, whether their permissions match their actual usage, what their devices look like, and what their behavioral history says is normal.
A SIEM doesn’t have this context because it only ingests logs. Exaforce builds a knowledge graph by fetching configuration state from every connected system — not just the events those systems produce, but the posture, permissions, and relationships that give events meaning.
Building Context: Configs, Not Just Logs
The biggest architectural difference between Exaforce and a SIEM isn’t how we process logs. It’s that we don’t stop at logs.
For every connected system, we fetch the configuration and identity state that lives alongside the event stream:
From identity providers (Okta, Azure AD, PingIdentity): User roles and admin status. MFA enrollment and factor strength per user. Group memberships. Application assignments. Session policies. Password policies. API token inventory with creation dates and scopes.
From MDM platforms (Jamf, Kandji, Intune): Device-to-user assignments. Device type, OS version, and compliance state. Installed applications. Browser extensions. Encryption status. EDR agent health.
From HR systems (BambooHR, Workday): Department, manager, job title, office location. Employment status and hire date. Termination date when applicable.
From cloud providers (AWS, GCP, Azure): IAM policies and role assignments. Resource tags (PII, production, public). Bucket permissions. Service account configurations. Cross-account trust relationships.
From SaaS applications (GitHub, Google Workspace, Slack, Atlassian): Organization settings. Repository permissions and visibility. OAuth app grants and token scopes. File sharing policies. Channel membership.
From the event stream itself: Behavioral baselines learned over time — which ASNs each user connects from, which cities, which tools, which event types, at what cadence. API endpoint request rates, parameter schemas, and response patterns.
This configuration state is what populates the knowledge graph.
The Knowledge Graph: How Context Becomes Structure
Configs and baselines are useful on their own. But their real power comes from the relationships between them. That’s what the knowledge graph captures.
The knowledge graph is a connected representation of your enterprise’s security-relevant state. It’s not a flat database of users and a separate database of devices and a separate database of cloud resources. It’s a graph of relationships:
- Jane belongs to Finance department which has access to production AWS account which contains S3 bucket tagged PII
- Jane is provisioned in Okta (admin), GitHub (member), Slack (member), AWS (IAM role JaneDev)
- Jane owns MacBook-serial-XYZ (from MDM) which runs CrowdStrike (agent healthy, last check-in 2 hours ago)
- Jane has OAuth grants to Backup Tool (read/write scope, last used 3 days ago) and CI/CD Tool (repo scope, last used yesterday)
- Jane reports to Bob who manages 5 other people in Finance
These relationships are what let the system answer questions that no log search can:
- “If Jane’s account is compromised, what can the attacker reach?”
- “Is this device Jane’s assigned laptop or an unknown machine?”
- “Does Jane’s actual permission usage justify her admin role?”
- “Has anyone else in Jane’s department ever logged in from this ASN?”
The graph has two layers. The context layer is built from configs — identity posture, device state, resource sensitivity, permissions, organizational structure. It changes slowly, updated as configs are re-fetched.
The knowledge graph for one identity: groups, roles, applications and the resources they reach, as one connected structure.
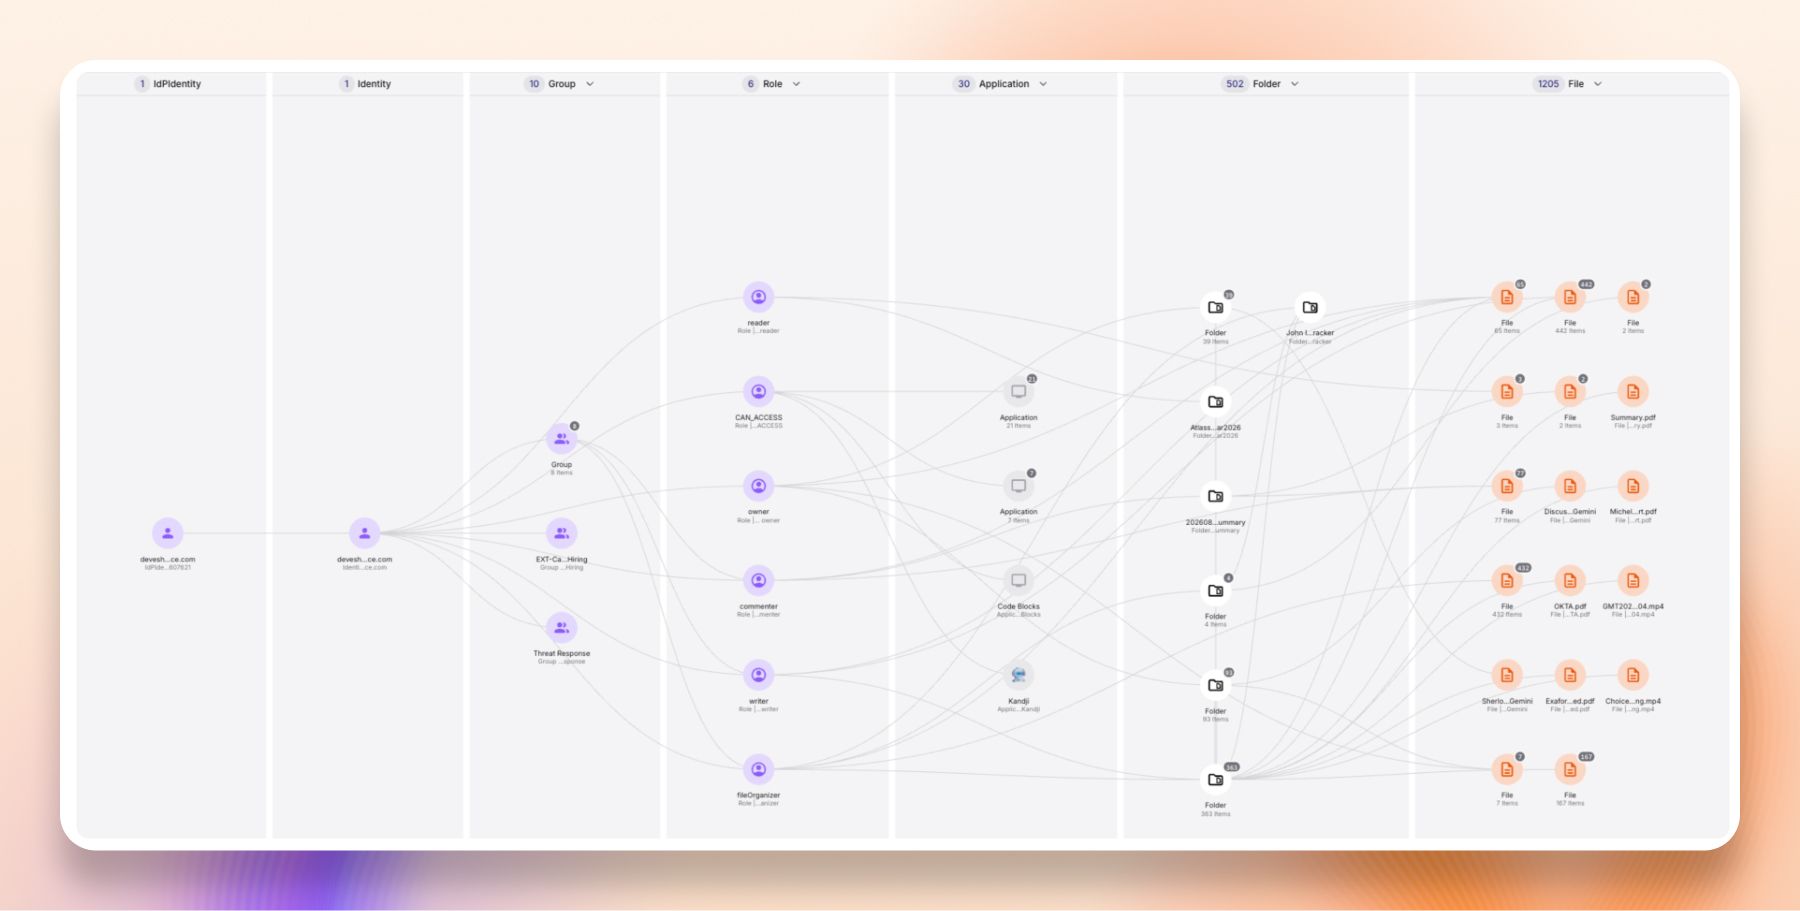
The activity layer is built from the semantic models described in Part 2 — the events that describe what people and applications actually do. Behavioral baselines sit at the intersection: they’re computed from the activity layer but queried alongside the context layer during detection.
The same graph narrowed to one user’s direct relationships.
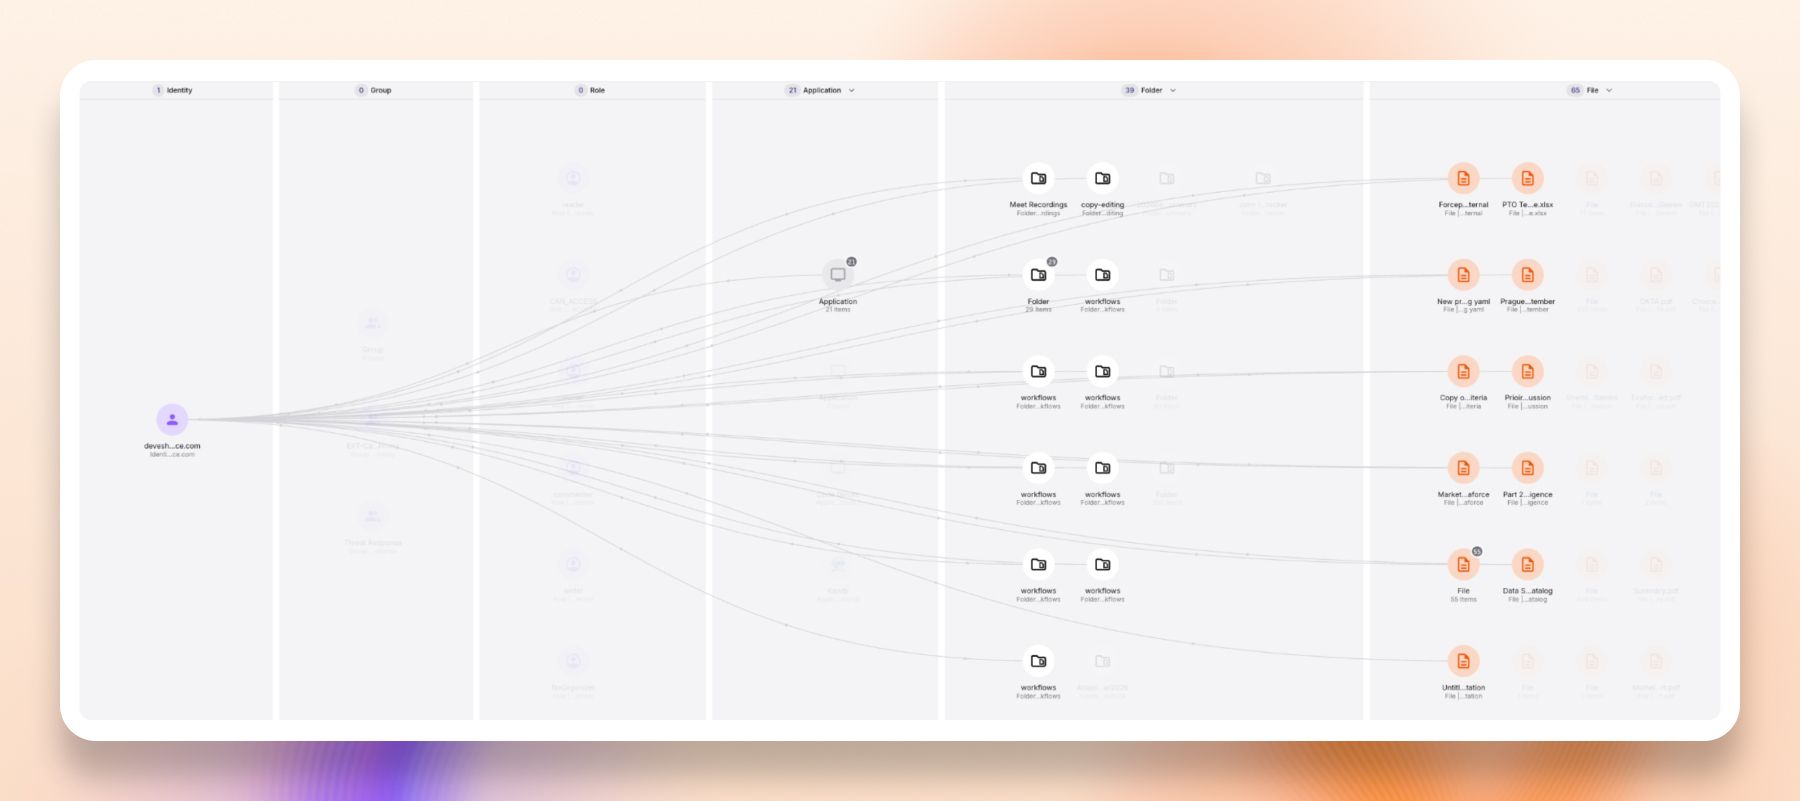
When a detection fires, it doesn’t search logs. It queries the graph. The event tells the system what happened. The graph tells it everything else — who is involved, what they have access to, what their history looks like, and whether the combination is normal or alarming.
This graph is continuously updated. When a user’s MFA enrollment changes in Okta, the graph reflects it. When a device is re-assigned in MDM, the graph reflects it. When HR marks someone as terminated, the graph reflects it. Detection rules always evaluate against current state, not a stale snapshot from when someone last ran an import.
Deep Posture Analysis: Role Right-Sizing
Fetching configs isn’t just about labeling users as “admin” or “not admin.” We analyze configurations deeply enough to determine whether a user’s permissions are appropriate for what they actually do.
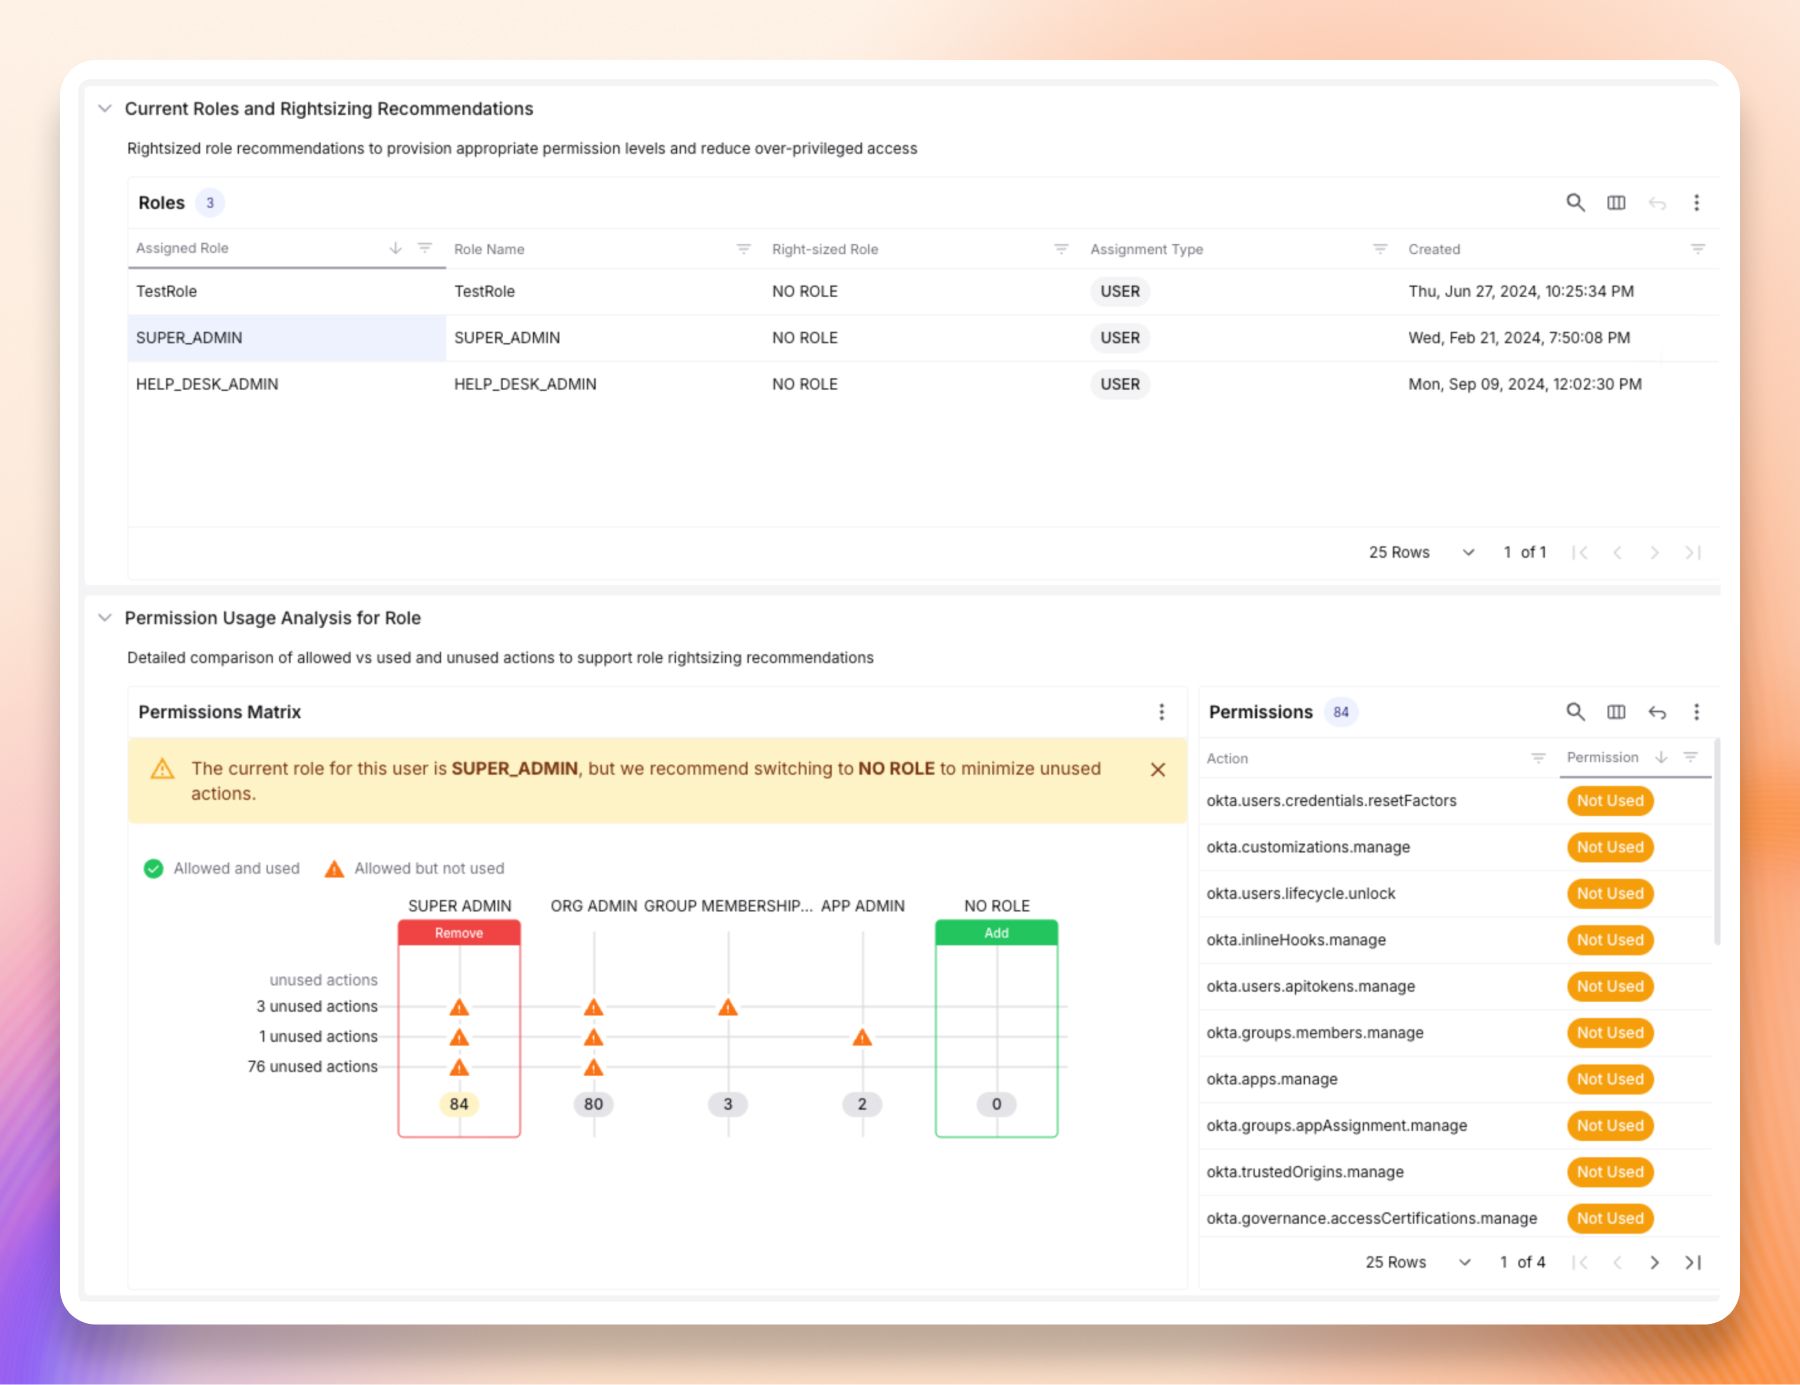
Take a concrete example. An Okta administrator has SUPER_ADMIN privileges. The system looks at what that administrator actually did over the past 90 days: which permissions did they use? Did they modify users, manage apps, change policies, or just view reports?
If the admin’s actual activity only required HELP_DESK_ADMIN or READ_ONLY_ADMIN privileges, the system flags this as an excessive permission grant — and recommends a specific right-sized role. The finding isn’t a vague “review this admin’s access.” It says: “Administrator Jane has SUPER_ADMIN privileges but her actual usage over the last 90 days only requires HELP_DESK_ADMIN. Recommended action: downgrade role.”
Role right-sizing for one Okta administrator: the assigned roles, the permissions each one allowed, how many were actually used over the period, and the recommended replacement.
The same analysis runs across every connected platform:
- Okta: Compares assigned admin roles against actual permission usage. Flags super admins who only perform help desk operations, app admins who only view reports, and API service integrations with broader permissions than their actual API calls require.
- GitHub: Compares organization and repository admin roles against actual activity. Flags admins who never use admin-level actions, repository admins with excessive permissions beyond their commit and review patterns, and outside collaborators with admin privileges.
- Azure AD / Entra: Compares directory role assignments against actual usage. Recommends specific role downgrades based on observed permission patterns.
- Google Workspace: Same pattern — compares assigned roles against permission usage and recommends right-sized alternatives.
- AWS: Analyzes IAM policies to find active identities with unused write permissions, unused list/read/tagging permissions, and human users with access keys that should be using SSO instead.
This is what it means to analyze configs, not just collect them. The system understands the permission model of each platform, observes what permissions are actually exercised over time, and identifies the gap between granted access and needed access. That gap is the attack surface that grows silently as organizations over-provision and forget to clean up.
How Context Enters Detection
All of this context — identity posture, permissions, device state, resource sensitivity, behavioral baselines, and right-sizing analysis — is available to the detection engine at evaluation time.
When a detection evaluates a set of events, it doesn’t just see the events. It sees:
- Identity posture: Is this person an admin? A service account? A contractor? Do they have strong MFA? Are they over-provisioned? Are they a new hire or a 10-year veteran? Have they been flagged as high-risk?
- Resource sensitivity: Is the S3 bucket tagged as PII? Is the code repo production-critical? Is the Drive file shared externally?
- Location and network history: Have we seen this user from this ASN before? This city? How does this compare to the organizational baseline?
- Device state: Is the device enrolled in MDM? Is the EDR agent healthy? Is this the user’s assigned device?
- Behavioral baselines: What does “normal” look like for this specific user, this specific endpoint, this specific API?
- Investigation state: Is this user already under investigation? Have previous findings been closed as false positives?
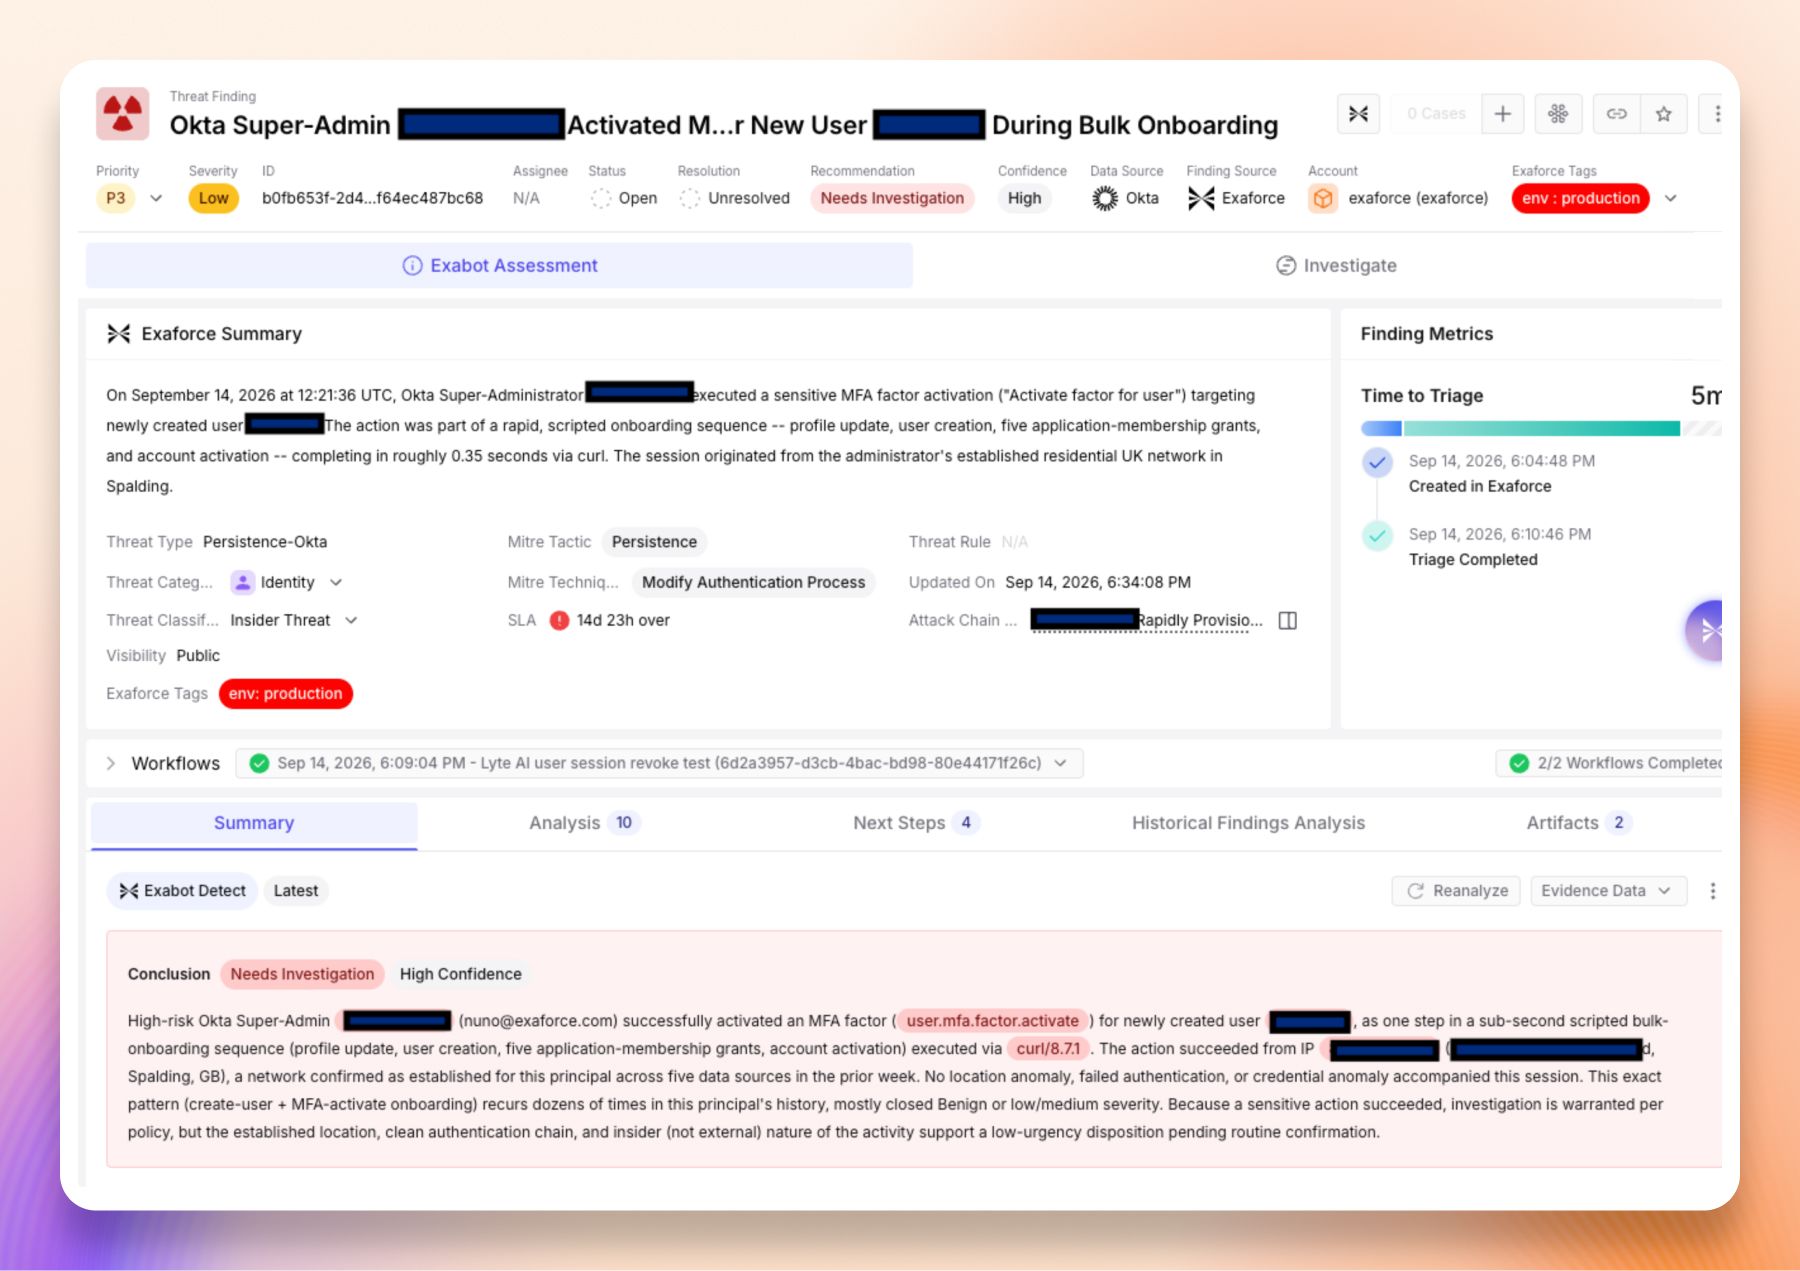
This means the same behavioral anomaly produces different outcomes depending on the context. A login from a new ASN by an over-provisioned super admin with weak MFA is a very different signal than the same login by a read-only user with strong MFA on a managed device. The detection engine knows the difference because the knowledge graph tells it.
Context deciding the outcome: a super admin activating an MFA factor for a new user during bulk onboarding is rated low, because the location, device and session history are all normal for that administrator.
Behavioral Baselines That Learn
Static detection rules have a short shelf life. A rule that flags logins from countries outside an allowlist works until people start traveling somewhere new. A threshold of 100 API calls per minute seems sensible until a team adopts a new CI/CD tool and the alert begins firing all day long.
Exaforce replaces static thresholds with behavioral baselines that learn what’s normal and adapt as the environment changes. Baselines are built for every significant dimension in the knowledge graph:
- Users and identities: Which ASNs and cities a user connects from, which event types they generate, which tools and user agents they use, their activity cadence and typical working hours, which resources they access. If Jane always uses Chrome on macOS from Comcast in New York, a python-requests call from Hetzner in Frankfurt stands out — not because Frankfurt is on a blocklist, but because it’s not Jane’s normal.
- Sub-principals (OAuth apps, API tokens, service accounts, AI agents): Separate baselines from the human they belong to. Which resources each token accesses, at what rate, from which IPs. A backup token that suddenly starts reading source code repos has its own anomaly, distinct from its owner’s.
- API endpoints: Request rates, expected parameters and types, response codes, the clients that call each endpoint. A spike in 5xx errors or a burst of requests with unfamiliar parameters is detected against that endpoint’s own history.
- Resources (repos, files, buckets, applications): Who normally accesses each resource, how frequently, and with what operations. An S3 bucket that normally sees 10 reads per day from 3 IAM roles stands out when a 4th role starts bulk-downloading from it.
- IP addresses and networks: Which users and organizations normally connect from each ASN. Whether a VPN provider is common across the company or seen for the first time. Whether a source IP has been associated with threat activity.
- Devices: Which processes normally run on each device, which users log into it, which networks it connects from, its typical software inventory. A new process or an unfamiliar login user on a device triggers against the device’s own baseline.
- Organizations and accounts: Account-wide patterns that provide a second layer of context. An ASN that’s new for a specific user but common across the organization is less concerning than one nobody has ever seen.
All baselines are gated on data sufficiency. The system won’t flag anomalies for users, endpoints, or resources within their history — new employees, newly created repos, recently onboarded data sources. With this approach adding a new integration doesn’t create an alert storm. The system knows it doesn’t know enough yet, and waits until it does.
What This Makes Possible
Here are a few examples of what context-rich detection looks like in practice — not an exhaustive list, but illustrations of how the knowledge graph changes what’s detectable.
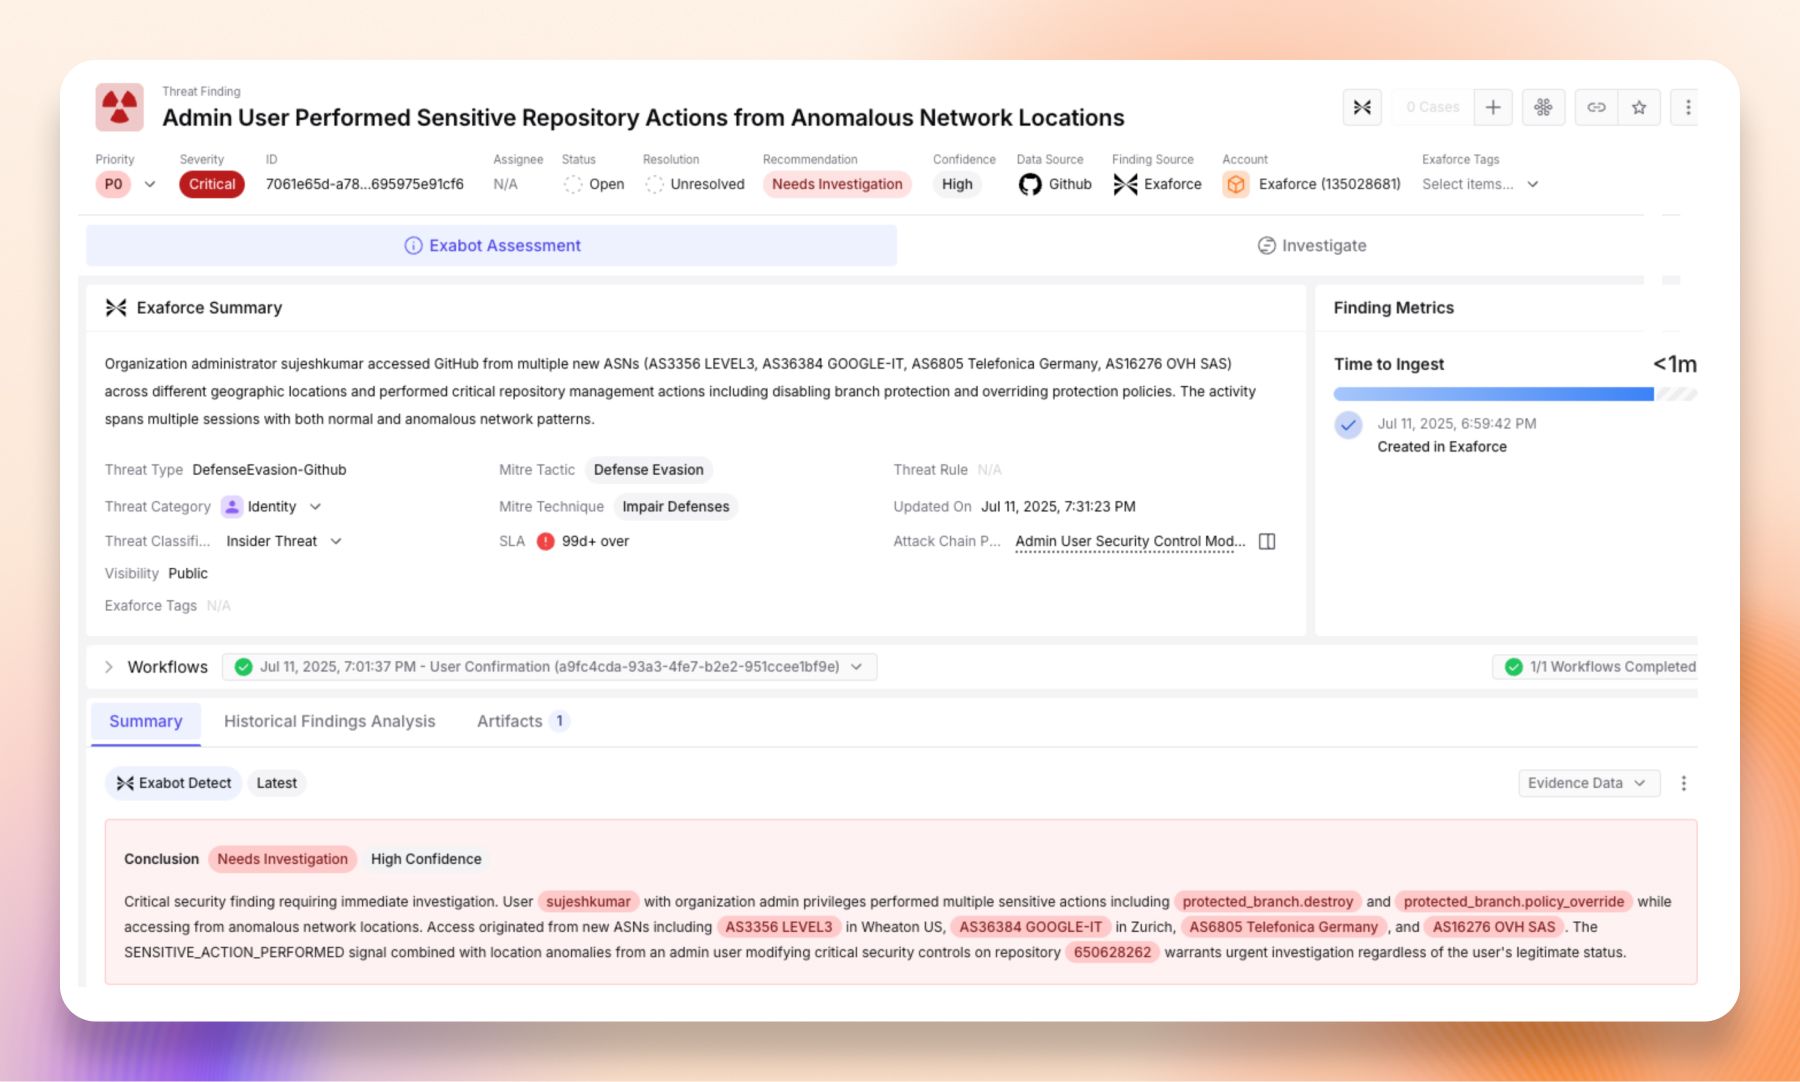
An over-provisioned admin logs in from an unfamiliar network and performs sensitive actions. The system knows three things a SIEM doesn’t: (1) this admin’s role should have been right-sized to read-only based on their actual usage, (2) the network is new for both the user and the organization, (3) the actions performed are admin-level operations the user hasn’t exercised in 90 days. Each fact raises the severity. Together, they form a high-confidence compound signal.
A compound signal: an organization administrator performing sensitive repository actions from networks never seen for the user or the organization.
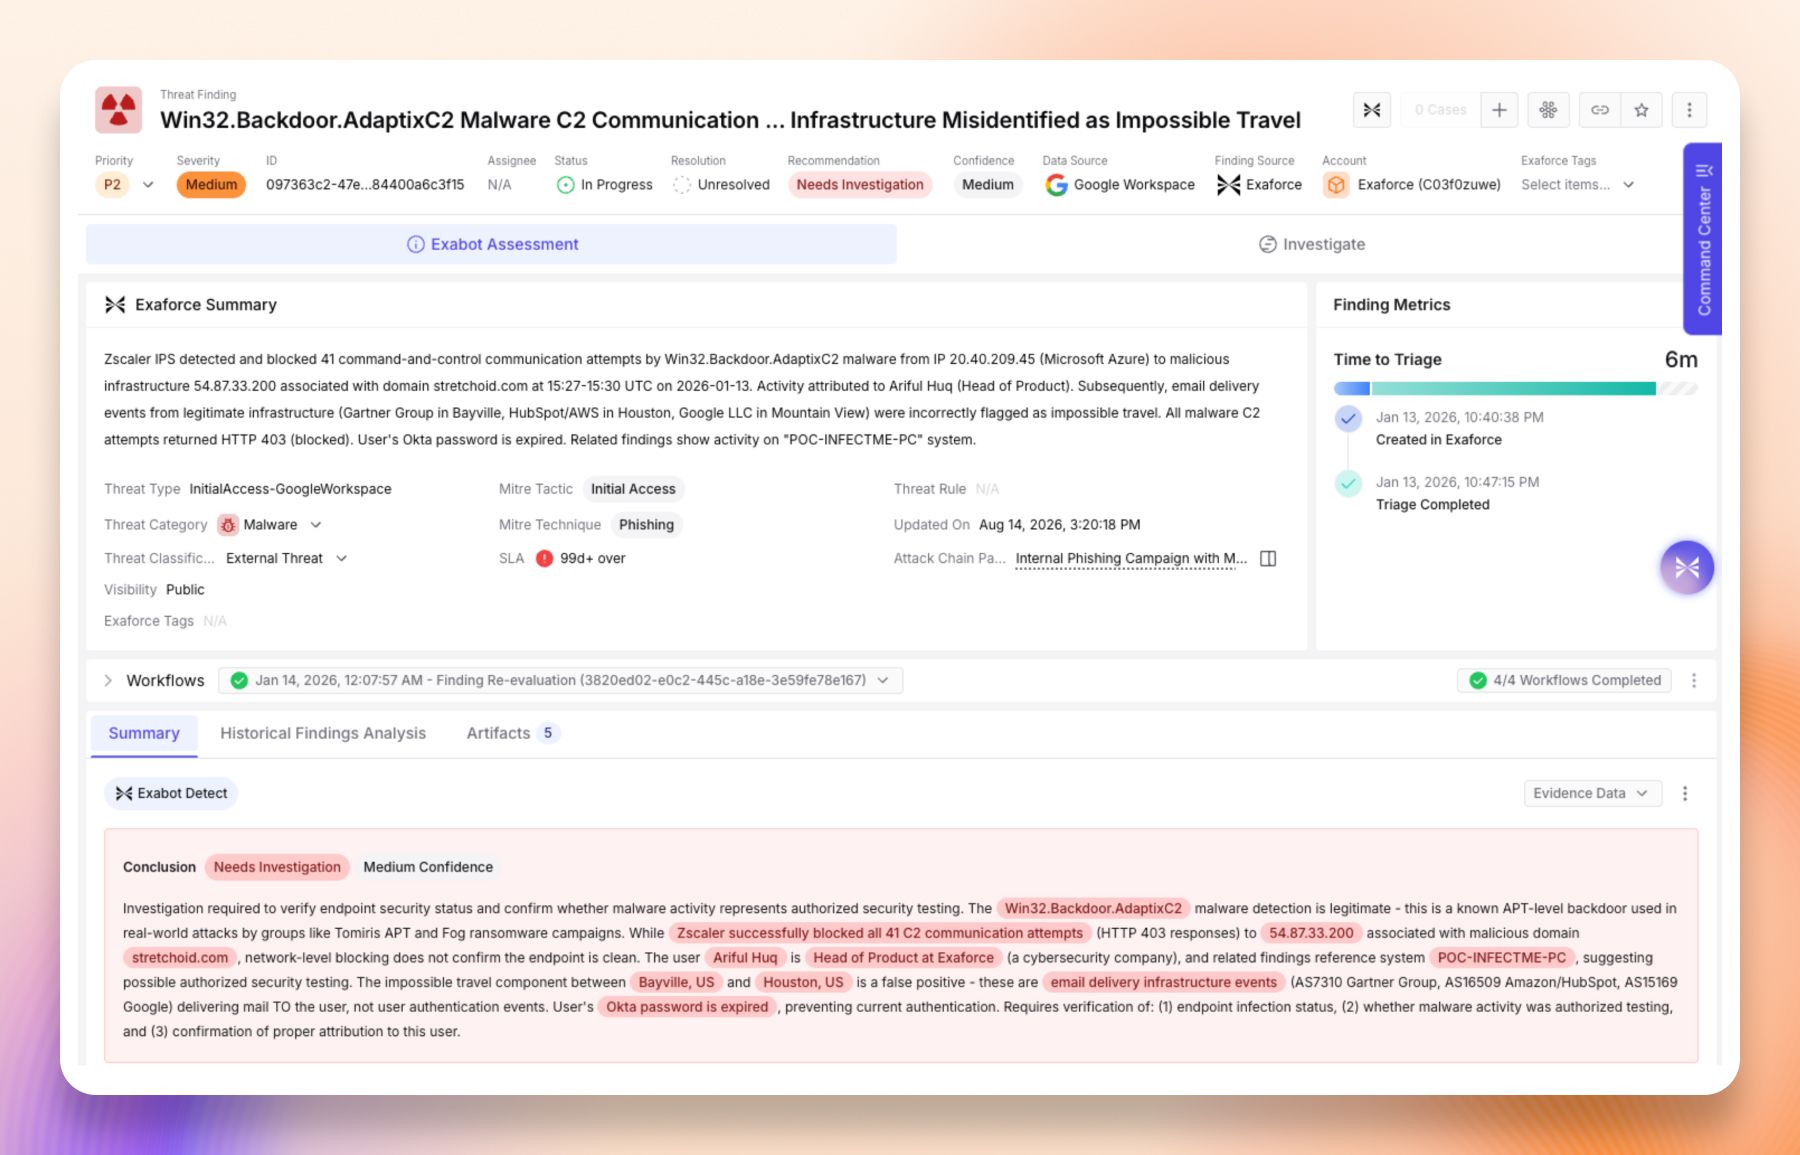
A phishing email arrives, and the recipient’s device shows malware minutes later. The email security system sees the phish. The EDR system sees the malware. Because the knowledge graph links the user to their device (via MDM), the system constructs the full chain: email delivered, attachment opened, suspicious process launched, outbound C2 connection. One finding, one narrative.
One finding, one narrative: a malware command-and-control detection joined to the user and device behind it.
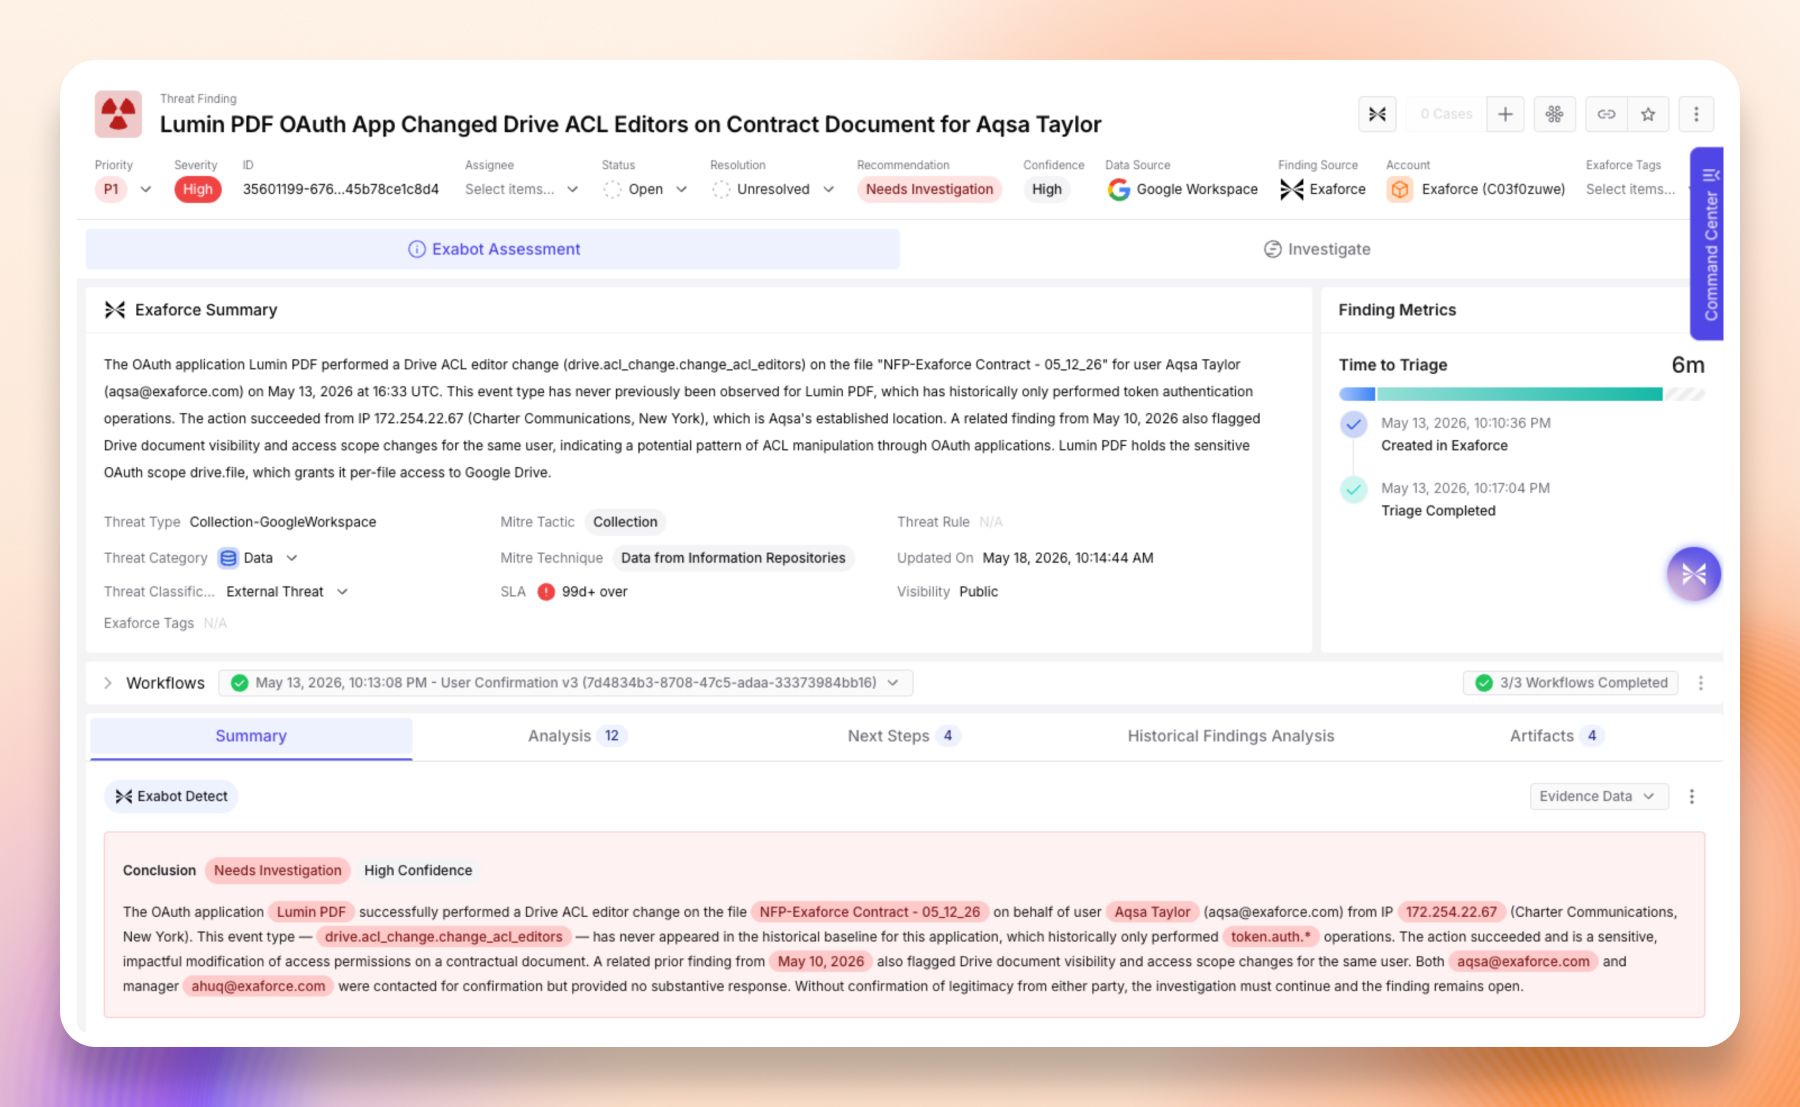
An OAuth token starts accessing resources outside its historical pattern. Because sub-principals are labeled on every event, the system builds separate baselines for each token and OAuth app. When a backup tool’s token suddenly starts reading source code repos it never touched before, the anomaly is detected on the token’s baseline — not confused with the human user’s activity.
A sub-principal finding: an OAuth app changing the sharing on a Drive document, detected on the app’s own baseline rather than its owner’s.
API requests arrive with parameters that don’t match the learned contract. The system knows what “normal” looks like for each endpoint — expected parameters, types, headers. A request with an unknown parameter containing SQL injection syntax is flagged — not because a WAF signature matched, but because the parameter was never part of the API’s observed contract.
A dormant user becomes active from a new city and performs admin actions within minutes. The system correlates three dimensions: 90+ days of inactivity, a city never seen for this user or the organization, and sensitive admin actions within 10 minutes of login. Any one of these might be innocuous. The combination, evaluated against the identity’s posture and baseline history, is a high-confidence indicator.
From Individual Signals to Attack Chains
Individual detection signals are useful, but the most dangerous threats rarely show up as a single anomaly. They unfold as a chain of events: a login from an unusual location leads to a privilege escalation, which opens the door to sensitive data, which is then quietly exfiltrated. Any one of those steps might look low-severity in isolation, and it’s only when you see them together that the real threat comes into focus.
Within a single data source, the knowledge graph enables the system to recognize these chains. When multiple signals fire for the same identity within a time window, the system doesn’t treat them as independent alerts. It evaluates them as a progression:
Credential compromise pattern in Okta: Login from a new ASN (low signal), followed by MFA fatigue push burst (medium signal), followed by a successful authentication (confirming the push was approved), followed by an admin role change (high signal). Four events, one story: someone brute-forced MFA and escalated privileges.
Insider data staging in Google Workspace: A user starts downloading files at 10x their normal rate (medium signal), from folders they’ve never accessed before (medium signal), with a shift to using the Drive API instead of the browser (low signal — detectable because sub-principal labeling distinguishes human from app activity). Individually, any of these could be a new project. Together, they match the pattern of data staging before exfiltration.
API probing sequence in access logs: Path traversal attempts on multiple endpoints (medium signal), followed by requests with injection payloads in query parameters (medium signal), followed by a spike in 5xx errors on a specific endpoint (medium signal), all from the same source IP within an hour. The sequence maps to a reconnaissance-to-exploitation progression.
The knowledge graph is what makes chain detection possible. Without identity resolution, you can’t connect the four Okta events to the same person. Without sub-principal labeling, you can’t see the shift from browser to API in Drive. Without API endpoint baselines, the probing sequence looks like normal traffic variation.
But single-source chains have a limit. Real attacks cross application boundaries — from one platform to another, from one identity to another, all belonging to the same person. In Part 4, we’ll show how cross-source chain detection works when every identity is resolved to a single Enterprise User.
What This Adds Up To
The knowledge graph — built from configs, enrichment, and learned baselines — is what separates “this event happened” from “this event matters.”
SIEMs and 3rd party detection systems (Endpoint, Network, Identity etc) fire an alert for every anomaly and leave the analyst to decide whether it’s important. Exaforce evaluates each anomaly against the full context: identity posture, right-sized permissions, resource sensitivity, device state, behavioral history, and investigation status. The result is fewer findings, at higher confidence, with the supporting context already assembled.
But all of this detection still happens within the scope of individual data sources and individual identities. Sophisticated attacks cross boundaries — from one application to another, from one identity to another, all belonging to the same person. In the next post, we’ll show how Exaforce resolves every per-application identity to a single Enterprise User, enabling cross-source detection that no single-source tool can perform.
Next: Part 4 — The Enterprise User: One Person, All Threats